Examples Gallery
Real-world, copy-paste-ready examples showcasing HolySheet's capabilities.
Basic Report · Light Theme
Sales Dashboard · Executive Theme
Portfolio Report · Dark Theme
Basic Report · Light Theme
Portfolio Report · Dark Theme
Full Showcase · Dark Theme
Sales Dashboard · Executive Theme
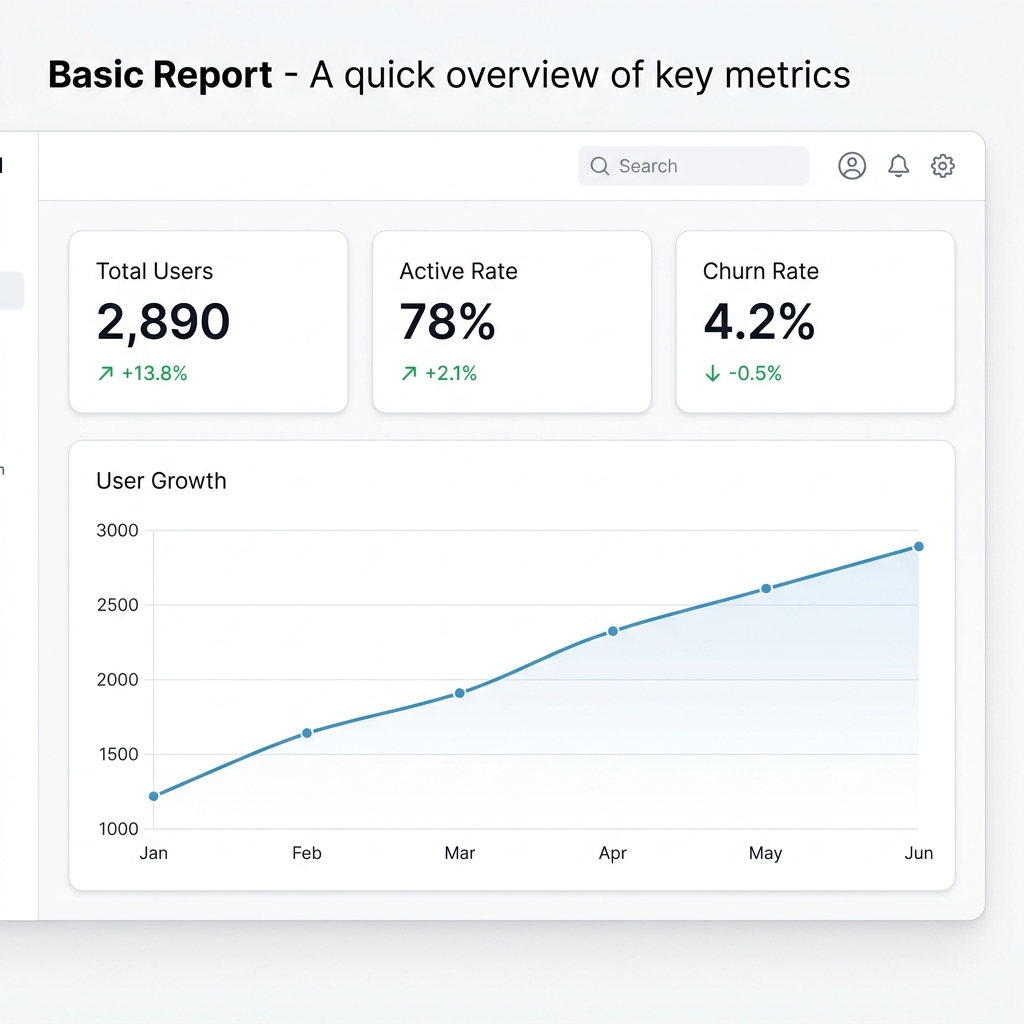
 Basic Report
A minimal report with KPI cards, a markdown intro, and a line chart.
from holysheet import Report, KPI, LineChart, Markdown

# Sample data
monthly_data = [
    {"month": "Jan", "users": 1_200},
    {"month": "Feb", "users": 1_450},
    {"month": "Mar", "users": 1_830},
    {"month": "Apr", "users": 2_100},
    {"month": "May", "users": 2_540},
    {"month": "Jun", "users": 2_890},
]

# Build the report
report = Report(
    title="Basic Report",
    subtitle="A quick overview of key metrics",
    theme="light",
)

# Add a markdown intro
report.add(Markdown(content=(
    "## Welcome\n\n"
    "This is a basic HolySheet report demonstrating KPI cards "
    "and a simple line chart."
)))

# Add KPI cards
report.add(KPI(label="Total Users", value="2,890", delta="+13.8%", status="positive"))
report.add(KPI(label="Active Rate", value=78, delta="+2.1%", status="positive", unit="%"))
report.add(KPI(label="Churn Rate", value="4.2%", delta="-0.5%", status="positive"))

# Add a line chart
report.add(LineChart(
    title="User Growth",
    data=monthly_data,
    x="month",
    y="users",
    height=400,
))

# Export
report.export_html("basic_report.html")
report.export_json("basic_report.json")
print("✓ Exported: basic_report.html, basic_report.json")
Output
A clean, light-themed dashboard with 3 KPI cards and a user growth line chart.
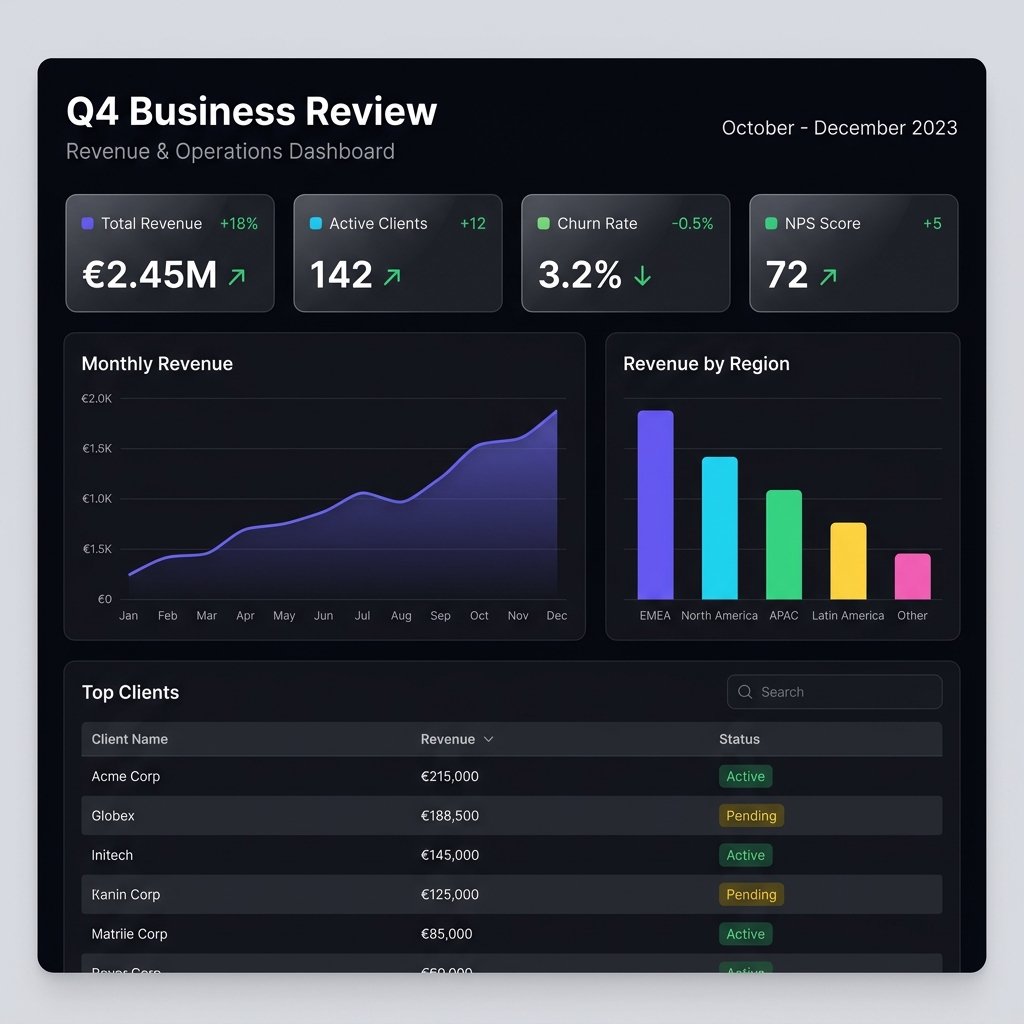
 Sales Dashboard
A comprehensive sales dashboard with sections, multiple chart types, and a data table — using the executive theme.
from holysheet import (
    KPI, BarChart, DataTable, LineChart, Markdown,
    PieChart, Report, Section,
)

# ── Data ──
monthly_sales = [
    {"month": "Jan", "sales": 245_000, "returns": 12_000},
    {"month": "Feb", "sales": 268_000, "returns": 15_000},
    {"month": "Mar", "sales": 312_000, "returns": 9_000},
    {"month": "Apr", "sales": 298_000, "returns": 11_000},
    {"month": "May", "sales": 342_000, "returns": 14_000},
    {"month": "Jun", "sales": 389_000, "returns": 8_000},
    {"month": "Jul", "sales": 356_000, "returns": 13_000},
    {"month": "Aug", "sales": 410_000, "returns": 10_000},
    {"month": "Sep", "sales": 445_000, "returns": 16_000},
    {"month": "Oct", "sales": 478_000, "returns": 12_000},
    {"month": "Nov", "sales": 512_000, "returns": 18_000},
    {"month": "Dec", "sales": 580_000, "returns": 22_000},
]

region_data = [
    {"region": "North America", "sales": 1_840_000},
    {"region": "Europe", "sales": 1_250_000},
    {"region": "Asia Pacific", "sales": 920_000},
    {"region": "Latin America", "sales": 410_000},
    {"region": "Middle East", "sales": 215_000},
]

channel_data = [
    {"channel": "Direct Sales", "revenue": 2_100_000},
    {"channel": "Online Store", "revenue": 1_500_000},
    {"channel": "Partners", "revenue": 800_000},
    {"channel": "Retail", "revenue": 450_000},
    {"channel": "Referrals", "revenue": 285_000},
]

top_deals = [
    {"deal": "Enterprise Suite - Acme Corp", "rep": "Michael Torres",
     "value": "$450,000", "stage": "Closed Won", "close_date": "2026-11-15"},
    {"deal": "Platform License - GlobalTech", "rep": "Sarah Kim",
     "value": "$320,000", "stage": "Negotiation", "close_date": "2026-12-01"},
    {"deal": "Data Analytics - FinCorp", "rep": "James Wilson",
     "value": "$280,000", "stage": "Closed Won", "close_date": "2026-10-28"},
    {"deal": "Cloud Migration - MedHealth", "rep": "Ana Garcia",
     "value": "$210,000", "stage": "Proposal", "close_date": "2026-12-15"},
    {"deal": "AI Integration - RetailMax", "rep": "David Chen",
     "value": "$195,000", "stage": "Closed Won", "close_date": "2026-11-20"},
]

# ── Build Report ──
report = Report(
    title="Q4 Sales Performance Dashboard",
    subtitle="Sales metrics, pipeline, and regional performance",
    theme="executive",
)

report.add(Markdown(content="""## Sales Overview

Q4 has been our strongest quarter yet, with **$4.64M** in total sales representing
a **23% increase** over Q3. The sales team has exceeded quota by 15%.
"""))

# KPIs
report.add(KPI(label="Total Sales", value="$4.64M", delta="+23%", status="positive"))
report.add(KPI(label="Deals Closed", value=127, delta="+18", status="positive"))
report.add(KPI(
    label="Win Rate", value=68, unit="%", delta="+4.2%", status="positive",
    description="Up from 63.8% last quarter",
))
report.add(KPI(label="Avg Deal Size", value="$36.5K", delta="+$2.1K", status="positive"))

# Sales trend
report.add(LineChart(
    title="Monthly Sales Trend",
    data=monthly_sales, x="month", y="sales", height=400,
))

# Regional breakdown
report.add(Section(
    title="Regional & Channel Analysis",
    description="Sales distribution by geography and channel",
    children=[
        BarChart(title="Sales by Region", data=region_data, x="region", y="sales"),
        PieChart(title="Revenue by Channel", data=channel_data, name="channel", value="revenue"),
    ],
))

# Top deals
report.add(DataTable(
    title="Top Deals This Quarter",
    data=top_deals,
    columns=["deal", "rep", "value", "stage", "close_date"],
))

# Export
report.export_html("sales_dashboard.html")
Output
An executive-themed sales dashboard with gold accents, KPI cards, line chart, regional analysis, and deal pipeline table.
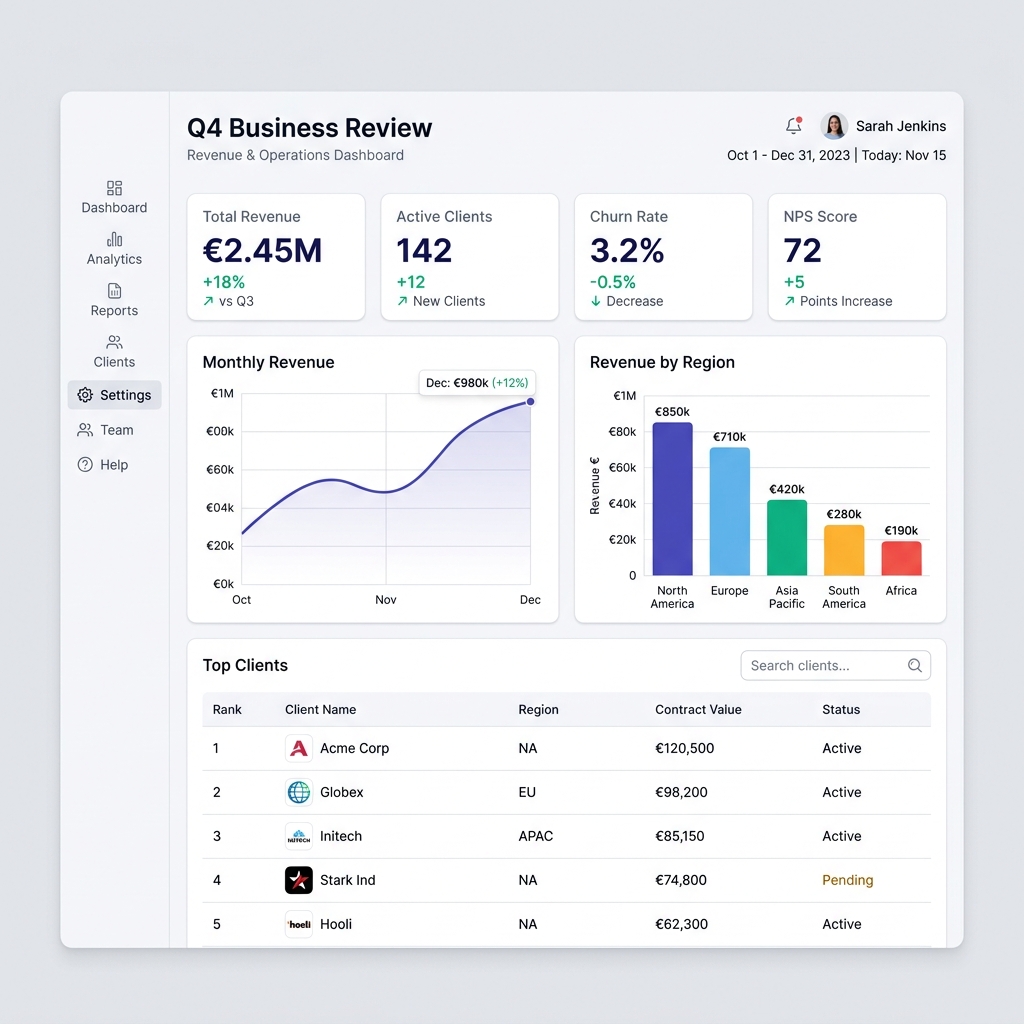
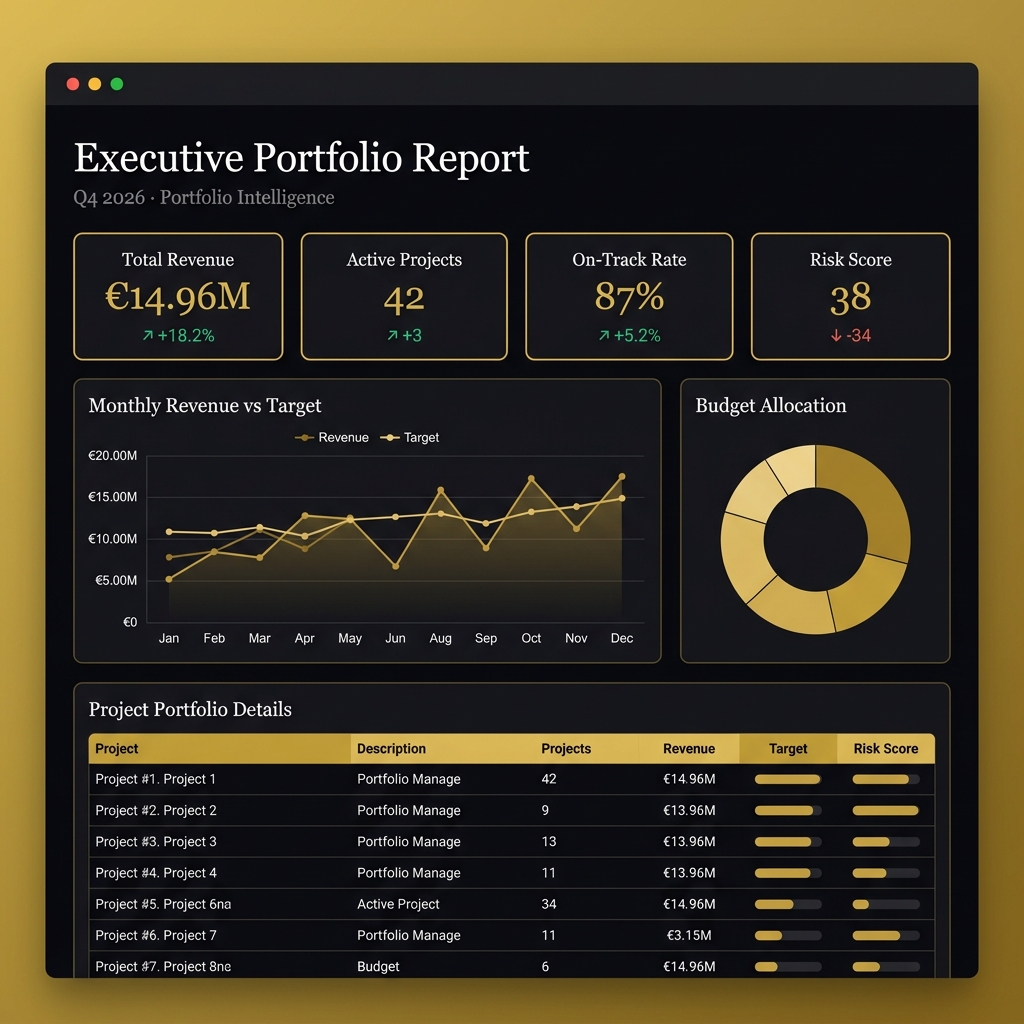
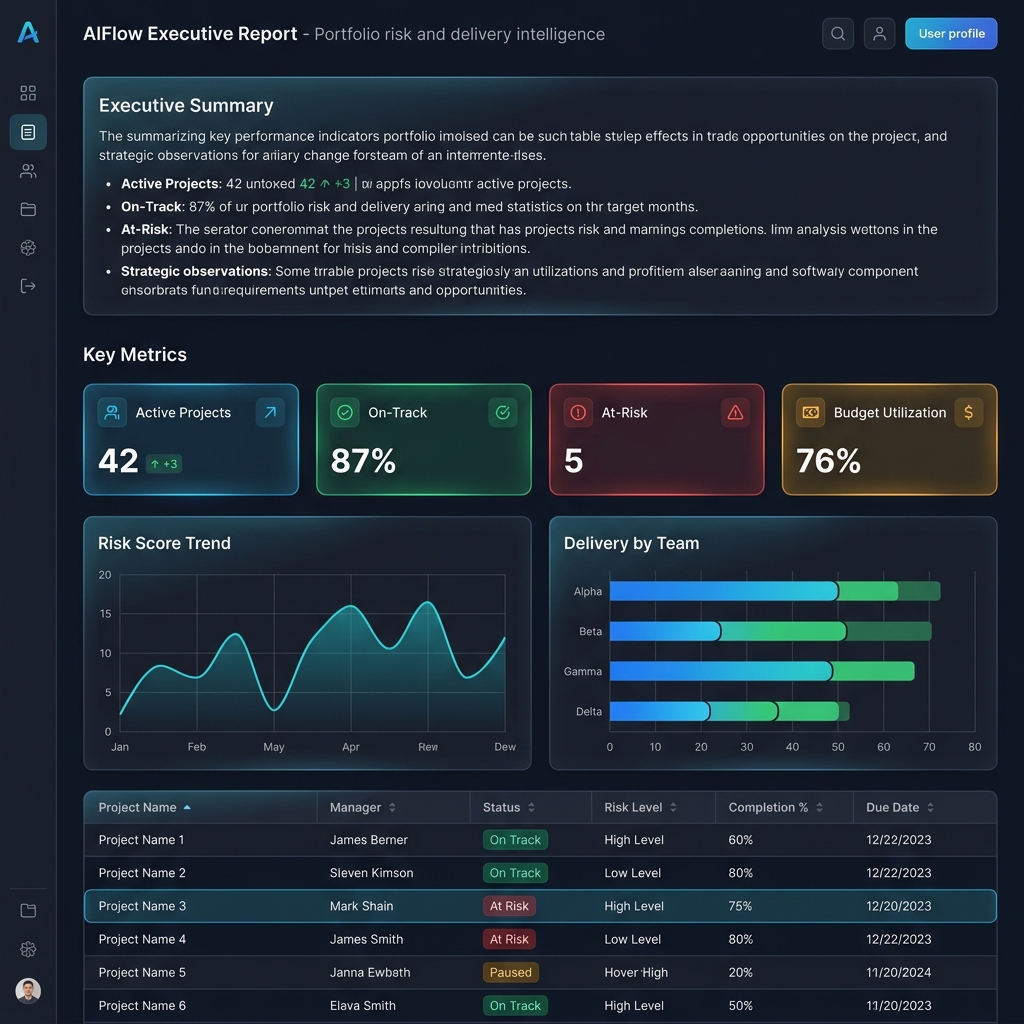
 Portfolio Report
An executive portfolio report with dark theme, nested sections, and multiple chart types.
from holysheet import (
    KPI, BarChart, DataTable, LineChart, Markdown,
    PieChart, Report, Section,
)

# ── Data ──
revenue_data = [
    {"month": "Jan", "revenue": 820_000, "target": 800_000},
    {"month": "Feb", "revenue": 910_000, "target": 850_000},
    {"month": "Mar", "revenue": 1_050_000, "target": 900_000},
    {"month": "Apr", "revenue": 980_000, "target": 950_000},
    {"month": "May", "revenue": 1_120_000, "target": 1_000_000},
    {"month": "Jun", "revenue": 1_250_000, "target": 1_050_000},
]

team_data = [
    {"team": "Platform", "delivered": 47, "planned": 52},
    {"team": "ML Ops", "delivered": 38, "planned": 40},
    {"team": "Frontend", "delivered": 55, "planned": 50},
    {"team": "Data Eng", "delivered": 32, "planned": 35},
]

budget_data = [
    {"category": "Engineering", "amount": 2_400_000},
    {"category": "Infrastructure", "amount": 800_000},
    {"category": "Marketing", "amount": 600_000},
    {"category": "Operations", "amount": 450_000},
]

projects_data = [
    {"project": "AIFlow Core v3", "owner": "Sarah Chen", "risk": "Low",
     "status": "On Track", "completion": "87%", "budget": "€1.2M"},
    {"project": "ML Pipeline", "owner": "Marcus Johnson", "risk": "Medium",
     "status": "At Risk", "completion": "62%", "budget": "€890K"},
    {"project": "Client Portal 2.0", "owner": "Ana Rodriguez", "risk": "Low",
     "status": "On Track", "completion": "91%", "budget": "€540K"},
    {"project": "Data Warehouse", "owner": "James Park", "risk": "High",
     "status": "Delayed", "completion": "45%", "budget": "€1.8M"},
]

# ── Build ──
report = Report(
    title="AIFlow Executive Portfolio Report",
    subtitle="Q4 2026 · Portfolio risk and delivery intelligence",
    theme="dark",
)

report.add(Markdown(content="""## Executive Summary

Portfolio health remains **strong** with 42 active projects delivering on schedule.
Risk-adjusted returns are trending positively, with a **12% improvement** in delivery
confidence over the past quarter.

- Revenue exceeded targets for 6 consecutive months
- Frontend team delivered 110% of planned capacity
- One project (Data Warehouse) requires executive attention
"""))

report.add(KPI(label="Total Revenue", value="€14.96M", delta="+18.2%", status="positive"))
report.add(KPI(label="Active Projects", value=42, delta="+3", status="positive"))
report.add(KPI(label="On-Track Rate", value=87, unit="%", delta="+5.2%", status="positive"))
report.add(KPI(label="Risk Score", value=38, delta="-34", status="positive",
               description="Lower is better"))

report.add(Section(
    title="Revenue & Financial",
    children=[
        LineChart(title="Monthly Revenue vs Target", data=revenue_data,
                  x="month", y=["revenue", "target"]),
        PieChart(title="Budget Allocation", data=budget_data,
                 name="category", value="amount"),
    ],
))

report.add(Section(
    title="Delivery & Operations",
    children=[
        BarChart(title="Team Delivery", data=team_data,
                 x="team", y=["delivered", "planned"]),
    ],
))

report.add(DataTable(title="Project Portfolio", data=projects_data))
report.export_html("portfolio_report.html")
Output
A dark-themed executive portfolio with KPIs, revenue trends, team delivery metrics, and a project details table.
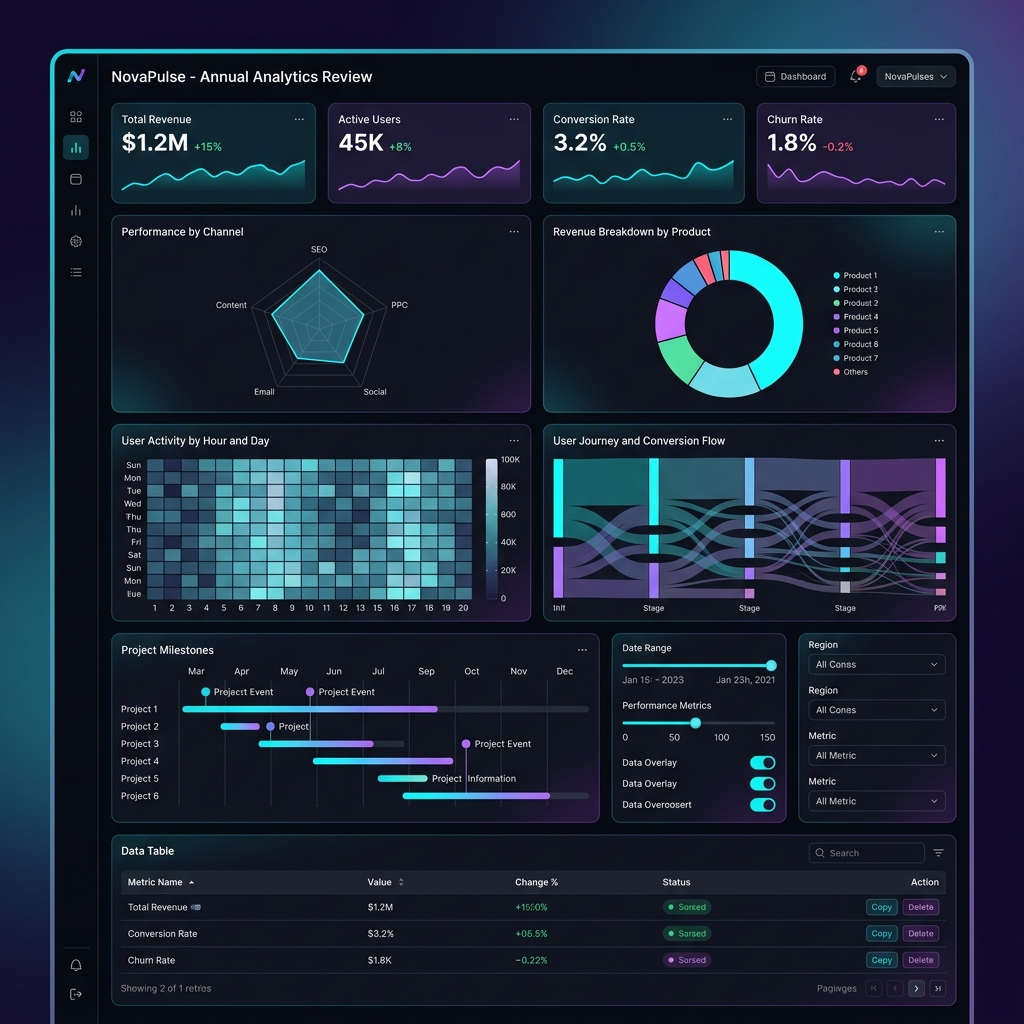
 Full Showcase
A comprehensive showcase of every block type — KPIs, metrics, all chart types, tables, markdown, code blocks, alerts, images, layout blocks, and more.
Full Showcase Code (click to expand)
from holysheet import (
    KPI, Alert, AreaChart, BarChart, CodeBlock, Columns,
    DataTable, Divider, FunnelChart, GaugeChart, Image,
    LineChart, Markdown, Metric, PieChart, ProgressBar,
    RadarChart, Report, ScatterChart, Section, Tabs, TreemapChart,
)

# ── Data ──
monthly_revenue = [
    {"month": "Jan", "revenue": 124_500, "costs": 78_200, "profit": 46_300},
    {"month": "Feb", "revenue": 138_200, "costs": 82_100, "profit": 56_100},
    {"month": "Mar", "revenue": 152_800, "costs": 85_600, "profit": 67_200},
    {"month": "Apr", "revenue": 149_300, "costs": 83_900, "profit": 65_400},
    {"month": "May", "revenue": 168_700, "costs": 91_200, "profit": 77_500},
    {"month": "Jun", "revenue": 185_400, "costs": 95_800, "profit": 89_600},
]

user_growth = [
    {"month": "Jan", "active_users": 12_400, "new_signups": 2_100},
    {"month": "Feb", "active_users": 14_200, "new_signups": 2_450},
    {"month": "Mar", "active_users": 16_800, "new_signups": 3_200},
    {"month": "Apr", "active_users": 18_500, "new_signups": 2_900},
]

segment_data = [
    {"segment": "Enterprise", "revenue": 980_000},
    {"segment": "Mid-Market", "revenue": 620_000},
    {"segment": "SMB", "revenue": 340_000},
]

funnel_data = [
    {"stage": "Visitors", "count": 148_200},
    {"stage": "Sign-ups", "count": 24_500},
    {"stage": "Activated", "count": 14_800},
    {"stage": "Paid", "count": 3_400},
]

treemap_data = [
    {"service": "Compute", "cost": 42_300},
    {"service": "Database", "cost": 28_700},
    {"service": "Analytics", "cost": 18_500},
    {"service": "Storage", "cost": 12_800},
]

radar_data = [
    {"team": "Engineering", "velocity": 92, "quality": 88,
     "collaboration": 76, "innovation": 95, "delivery": 84},
    {"team": "Product", "velocity": 78, "quality": 91,
     "collaboration": 94, "innovation": 87, "delivery": 82},
]

scatter_data = [
    {"feature": "Alerts", "usage": 89, "satisfaction": 4.7, "users": 3200},
    {"feature": "Charts", "usage": 76, "satisfaction": 4.5, "users": 2800},
    {"feature": "API", "usage": 62, "satisfaction": 4.2, "users": 1900},
]

customers = [
    {"company": "Meridian Corp", "plan": "Enterprise", "mrr": "$12,400"},
    {"company": "Atlas Dynamics", "plan": "Enterprise", "mrr": "$9,800"},
    {"company": "Helix Systems", "plan": "Mid-Market", "mrr": "$5,600"},
]

# ── Report ──
report = Report(
    title="NovaPulse — Annual Analytics Review",
    subtitle="Comprehensive platform metrics • FY 2025",
    theme="dark",
)

# Hero
report.add(Markdown(content="# 📊 NovaPulse Annual Review\n\nWelcome to the full showcase."))
report.add(Alert(severity="success", title="🎉 Milestone Reached",
                 message="42,000 monthly active users — exceeding target by 20%."))

# KPIs
report.add(Divider(label="Key Performance Indicators"))
report.add(Columns(children=[
    KPI(label="Annual Revenue", value="$2.26M", delta="+34%", status="positive"),
    KPI(label="Active Users", value="42,000", delta="+72%", status="positive"),
    KPI(label="NRR", value="127%", delta="+8pp", status="positive"),
    KPI(label="Churn", value="2.1%", delta="-0.6pp", status="positive"),
]))

# Compact metrics
report.add(Columns(children=[
    Metric(label="Avg. Deal Size", value="$4,850"),
    Metric(label="LTV:CAC", value="5.2x"),
    Metric(label="Onboarding", value="3.4 days"),
    Metric(label="NPS", value=72),
]))

# Revenue with tabs
report.add(Section(
    title="💰 Revenue Analytics",
    children=[Tabs(tabs=[
        {"label": "📈 Trend", "children": [
            LineChart(title="Revenue, Costs & Profit", data=monthly_revenue,
                      x="month", y=["revenue", "costs", "profit"]),
        ]},
        {"label": "🍩 Segments", "children": [
            PieChart(title="Revenue by Segment", data=segment_data,
                     name="segment", value="revenue"),
        ]},
    ])],
))

# Growth
report.add(Section(
    title="🚀 User Growth",
    children=[
        AreaChart(title="Active Users", data=user_growth,
                  x="month", y=["active_users", "new_signups"]),
        FunnelChart(title="Conversion Pipeline", data=funnel_data,
                    name="stage", value="count"),
    ],
))

# Product intelligence
report.add(Columns(children=[
    ScatterChart(title="Feature Usage vs Satisfaction", data=scatter_data,
                 x="usage", y="satisfaction", size="users"),
    RadarChart(title="Team Performance", data=radar_data,
               indicators=["velocity", "quality", "collaboration",
                            "innovation", "delivery"]),
]))

# Infrastructure
report.add(Section(
    title="🖥️ Infrastructure",
    children=[
        TreemapChart(title="Cloud Costs", data=treemap_data,
                     name="service", value="cost"),
        Columns(children=[
            GaugeChart(title="Uptime", value=99.97, min=99, max=100, unit="%"),
            GaugeChart(title="Response", value=142, min=0, max=500, unit="ms"),
        ]),
        Columns(children=[
            ProgressBar(label="CPU", value=73, description="18/24 vCPUs"),
            ProgressBar(label="Memory", value=61, description="49/80 GB"),
            ProgressBar(label="Network", value=88, color="#EF4444"),
        ]),
    ],
))

# Data table
report.add(DataTable(title="Top Accounts", data=customers))

# Alerts
report.add(Alert(severity="warning", title="Cost Alert",
                 message="Compute costs increased 18% month-over-month."))

# Code block
report.add(CodeBlock(
    code="from holysheet import Report, KPI\nreport = Report(theme='dark')\nreport.export_html('report.html')",
    language="python", title="Quick Start",
))

# Footer
report.add(Markdown(content="---\n\n**Generated by HolySheet v0.2.0** · MIT License"))

report.export_html("full_showcase.html")