Project Dashboard
A 24-card, drag-and-drop bento-grid dashboard that gives you a complete picture of your project at a glance. Every card is interactive — click "Ask JP" on any widget for instant AI analysis.
The Command Center
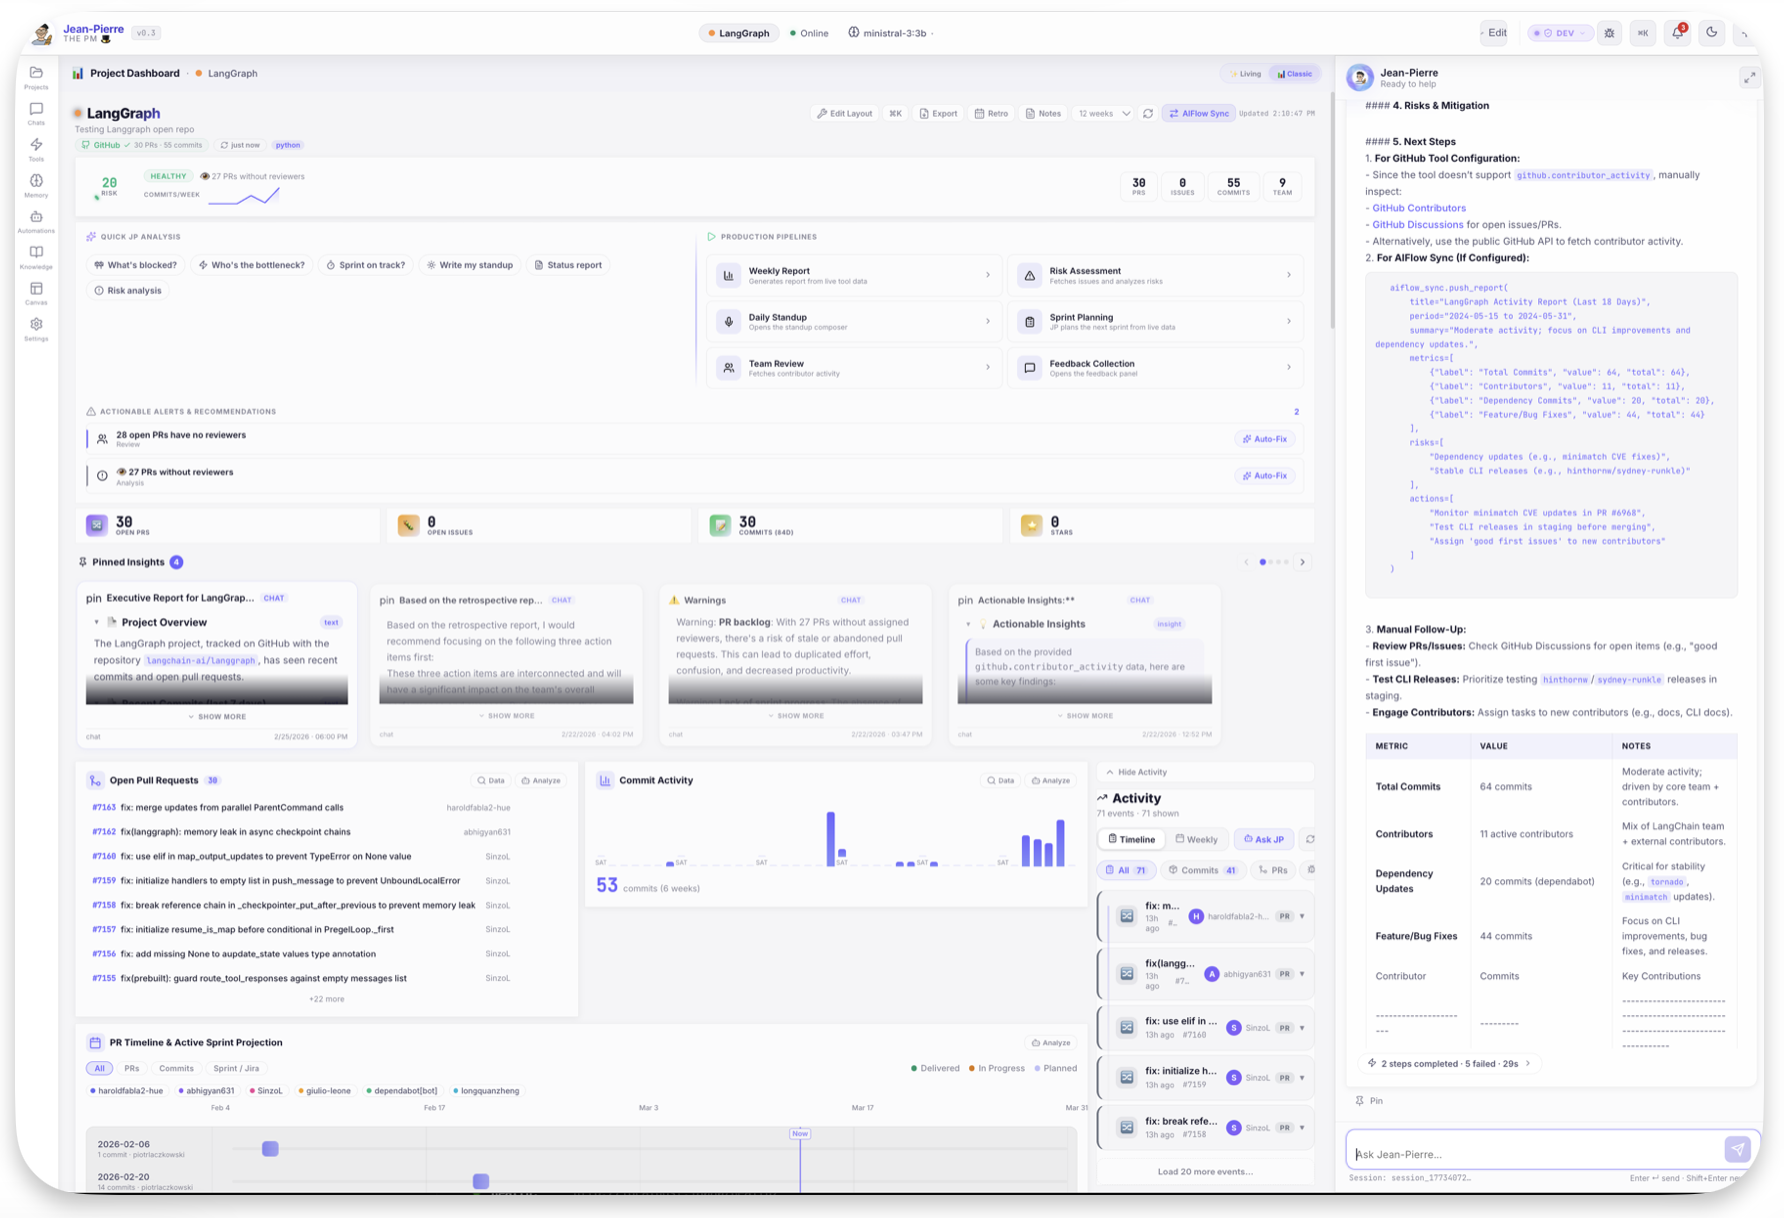
Every card is draggable, resizable, and interactive. Click any card's "Ask JP" button to get an instant AI analysis of that specific metric, or use the production pipelines to generate full reports.
High-Density Widgets
Risk Radar
0–100 risk score calculated from stale PRs, low velocity, sprint lag, and open blockers. Know your project's health at a glance.
Velocity Charts
8-week stacked author velocity and contribution heatmaps. Spot slowdowns before they impact delivery.
Smart Gantt
Auto-generated timelines derived from real PR activity and sprint data. No manual updates needed.
Action Center
Centralized risk assessment with AI-recommended next steps, checkable task lists, and real-time progress tracking.
Dynamic Card Library
The dashboard includes a comprehensive set of widgets that auto-populate with your live project data:
| Card | Description |
|---|---|
| KPIs | Open PRs, issues, commits, stars — dynamic labels based on selected date range |
| Pull Requests | Live PR list with AI-powered reviewer suggestions and age tracking |
| Sprint Status | Jira metrics visualized as progress rings (WIP vs Done vs Todo) |
| Mind Map | Visual dependency graph of Jira issues, epics, and relationships |
| Leaderboard | Gamified team contribution metrics with streaks and badges (🔥🥇👑) |
| Activity Feed | Reverse-chronological timeline of all project events |
| Commit Activity | Per-author commit charts with trend analysis |
| PR Timeline | Visual PR lifecycle from open to merge |
| Contribution Heatmap | 26-week contribution heatmap per author |
| Pinned Insights | Carousel of past AI analyses and saved recommendations |
| Actionable Alerts | AI-detected risks with auto-fix suggestions |
| Production Pipelines | One-click report generators (Weekly, Risk, Standup, Sprint) |
Living View Mode
Toggle between two distinct visual experiences:
Classic Bento
Traditional card grid. Best for dense information review and dashboard building.
Living Orbital
An animated, immersive view with Jean-Pierre at the center. Widgets orbit the agent as interactive nodes.
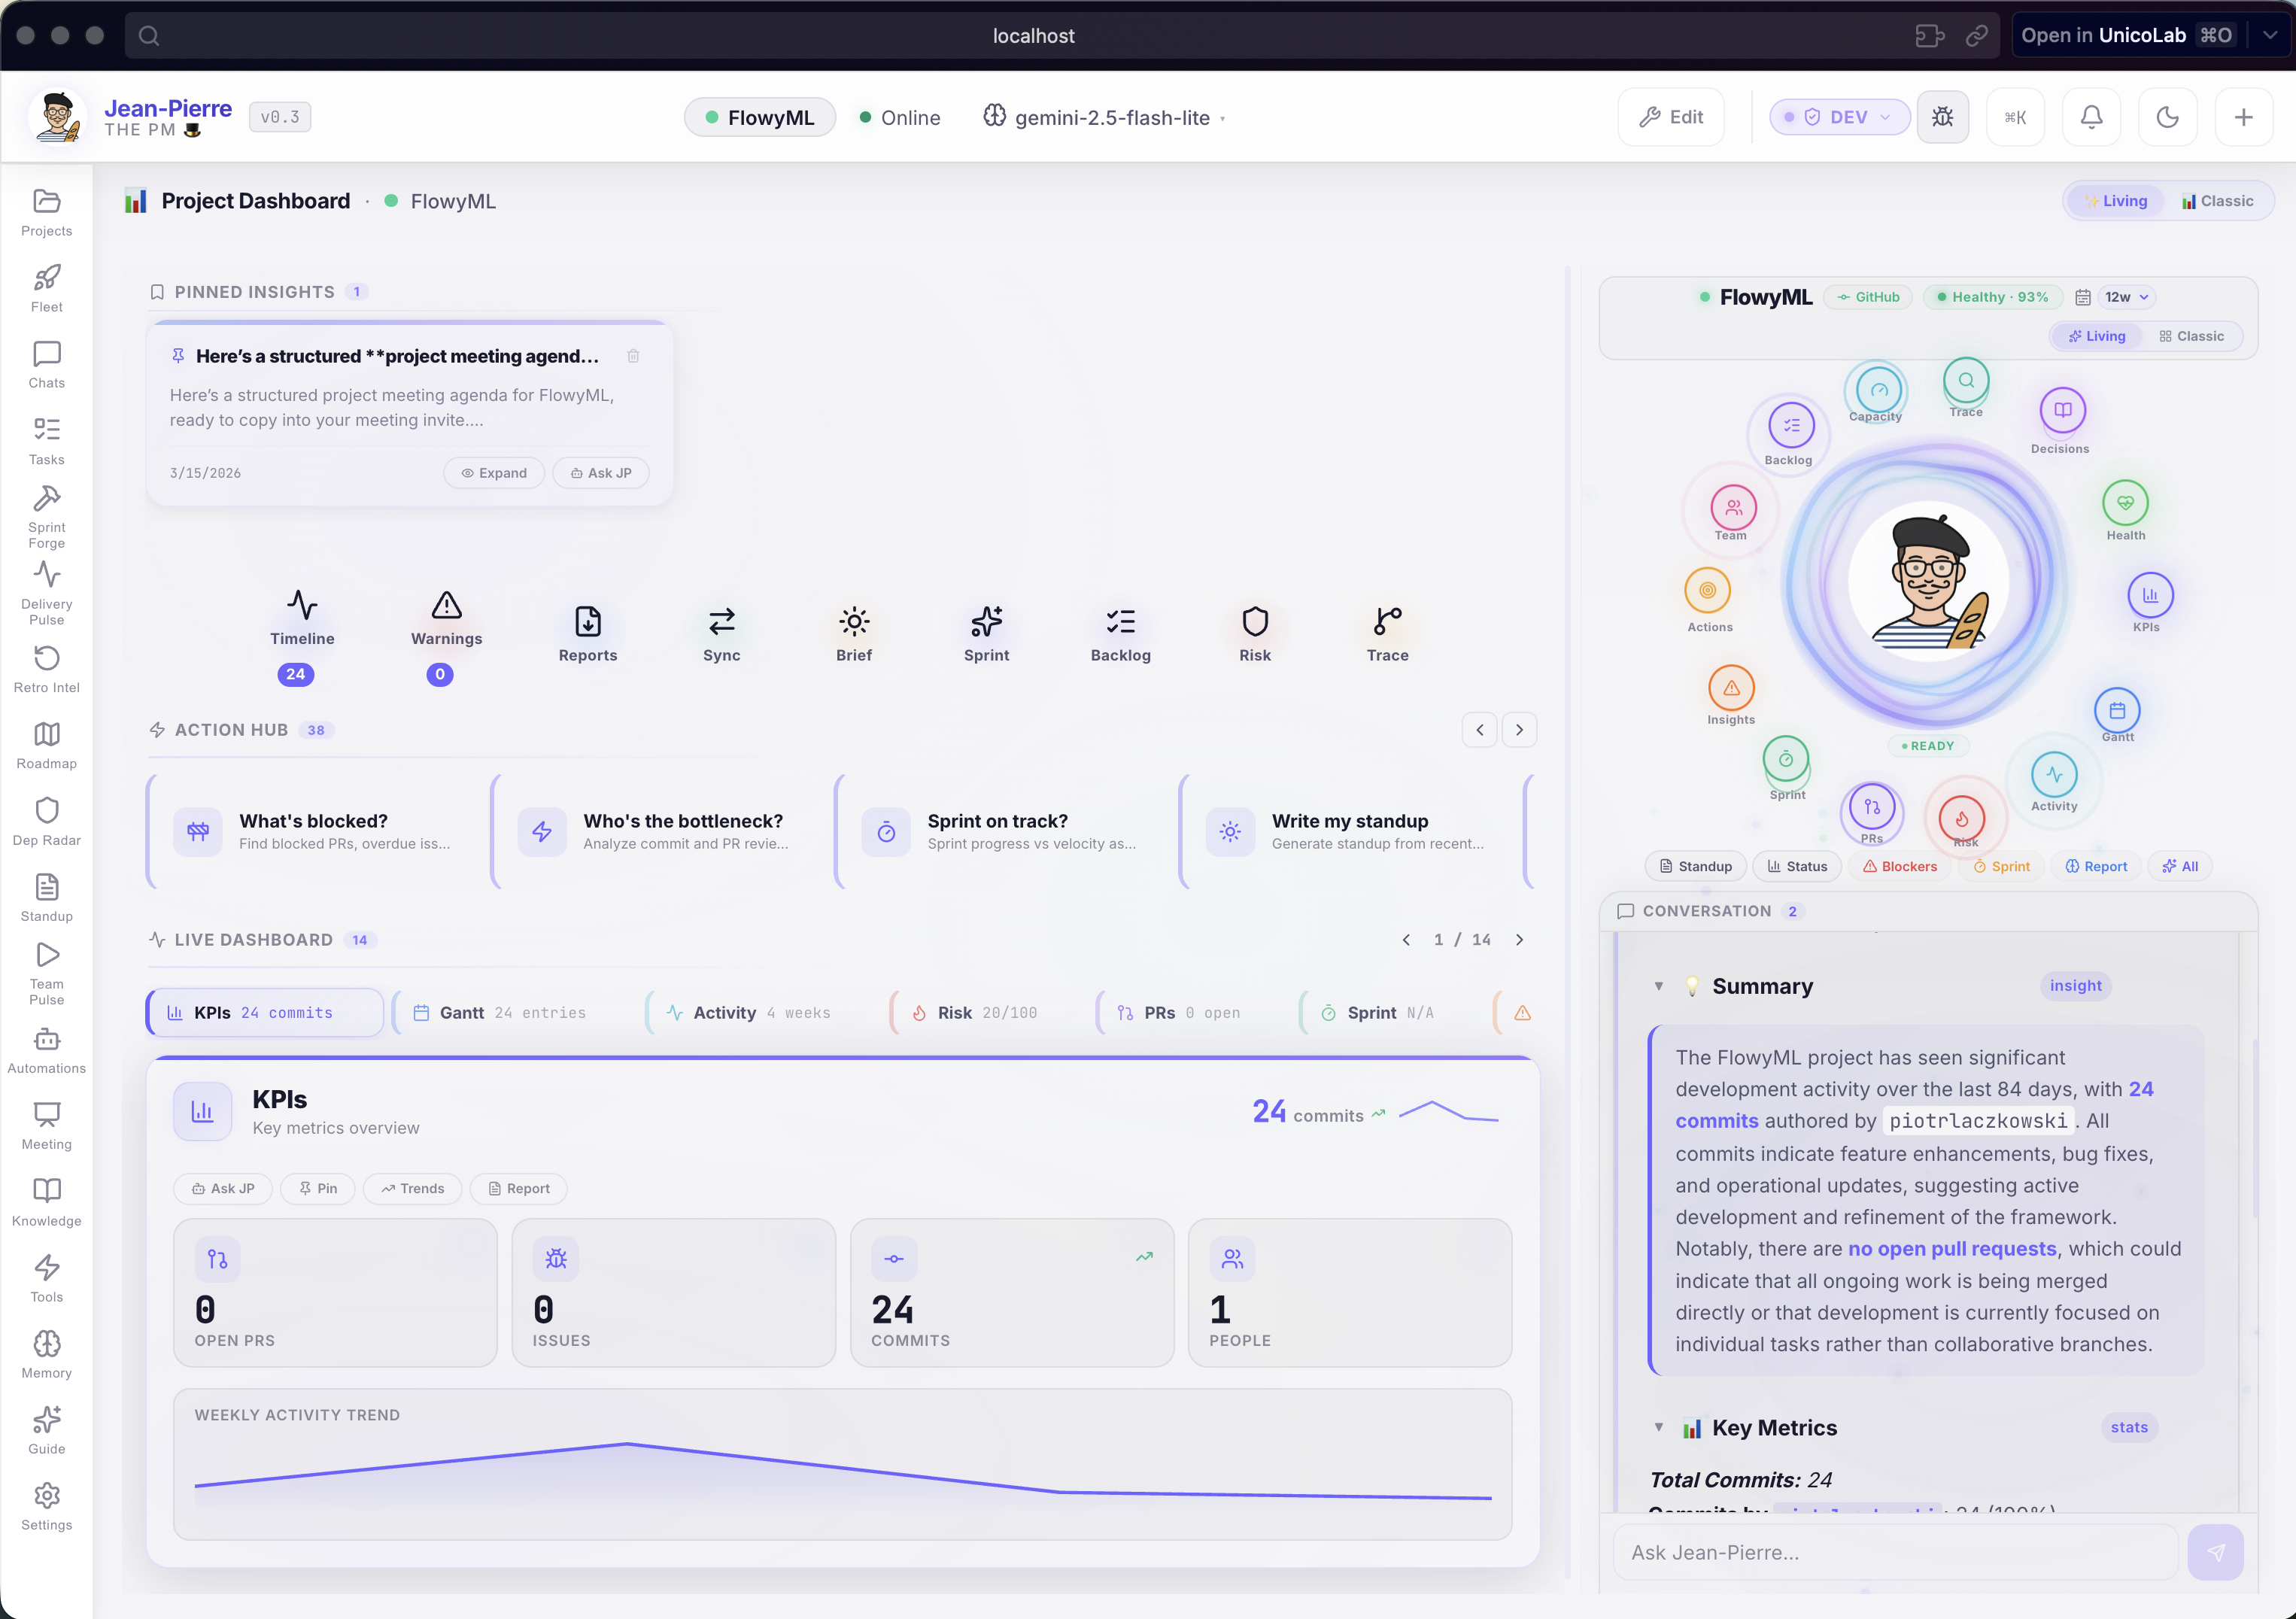
Pro Tip
Hover over the Jean-Pierre avatar in the center of the orbital view to see his current "mood" based on project health scores.
Keyboard Mastery
Press ++cmd+k++ anytime to open the Command Palette.
| Action | Shortcut |
|---|---|
| Refresh Data | ++cmd+r++ |
| Search Engine | ++cmd+k++ |
| Toggle Sidebar | ++cmd+b++ |
| Agent Settings | ++cmd+comma++ |