🖥️ GUI Dashboard Tour
🖥️ FlowyML GUI — Visual Interface Guide
FlowyML ships with a full-featured web dashboard that lets you manage every aspect of your ML lifecycle — from pipeline execution and artifact inspection to model evaluation and GenAI observability — all without leaving your browser.
🌐 Web Dashboard 📊 Real-Time Metrics 🔗 DAG Visualization 🧪 Experiment Tracking 🤖 GenAI Traces 🔌 Plugin Marketplace 🚀 One-Click Deploy
Launching the Dashboard
Start the FlowyML GUI with a single command:
This starts the local web server (default: http://localhost:8080). The dashboard is also available via the centralized FlowyML Server deployment for team collaboration.
Pro Tip
Use flowyml ui --port 9000 to run on a custom port, or flowyml ui --host 0.0.0.0 to expose the dashboard on your network.
Dashboard — Command Center
The Dashboard is your landing page — a high-level command center showing the health and activity across your entire ML workspace.
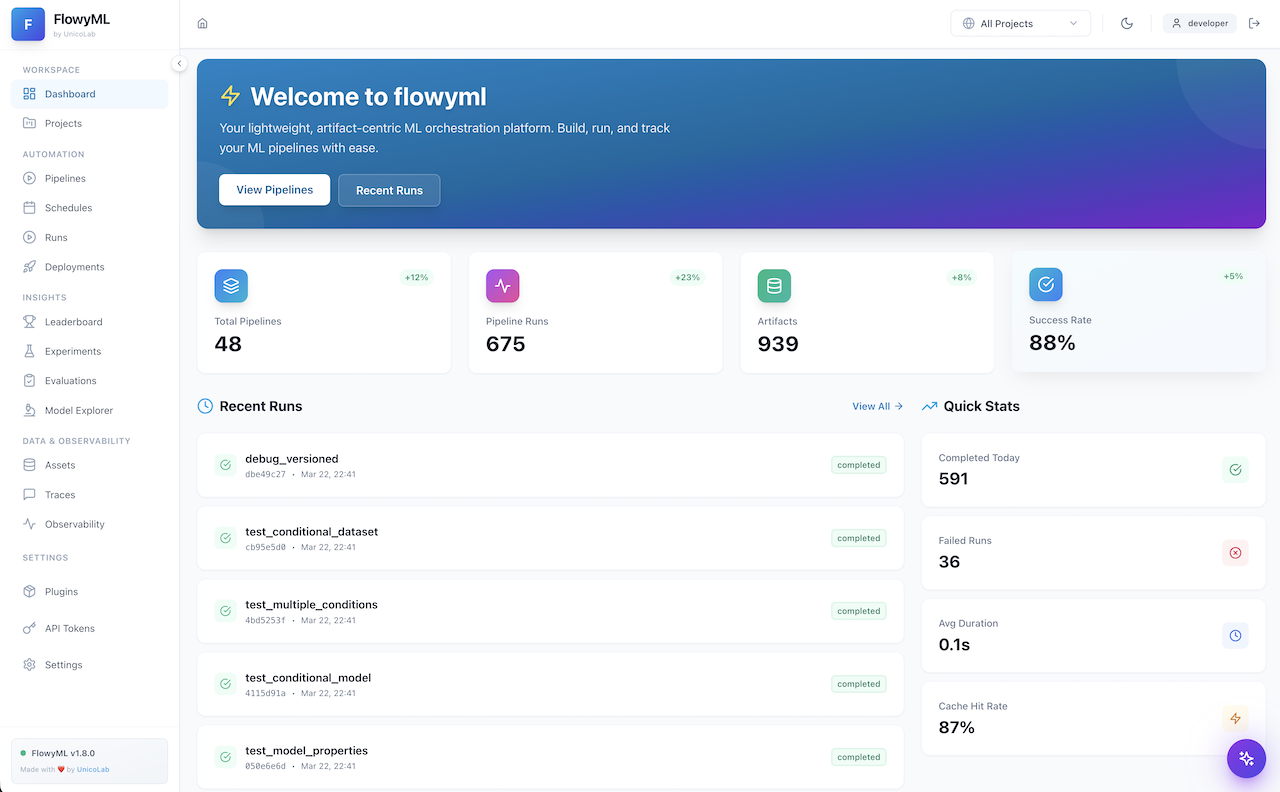
Key elements:
| Area | Description |
|---|---|
| Workspace Sidebar | Quick navigation across all sections: Pipelines, Runs, Assets, Traces, and more |
| Project Selector | Filter the entire view by project via the top-right dropdown |
| Activity Feed | Recent pipeline runs, evaluations, and system events at a glance |
| Quick Stats | KPI cards showing run counts, success rates, and active deployments |
Dark Mode
Toggle between light and dark themes using the 🌙 icon in the top-right corner. All screenshots in this guide use the light theme, but every page is fully styled for both modes.
Projects — Organize Your Work
The Projects page provides a structured view of all your ML projects with metadata, pipeline associations, and quick-access links.
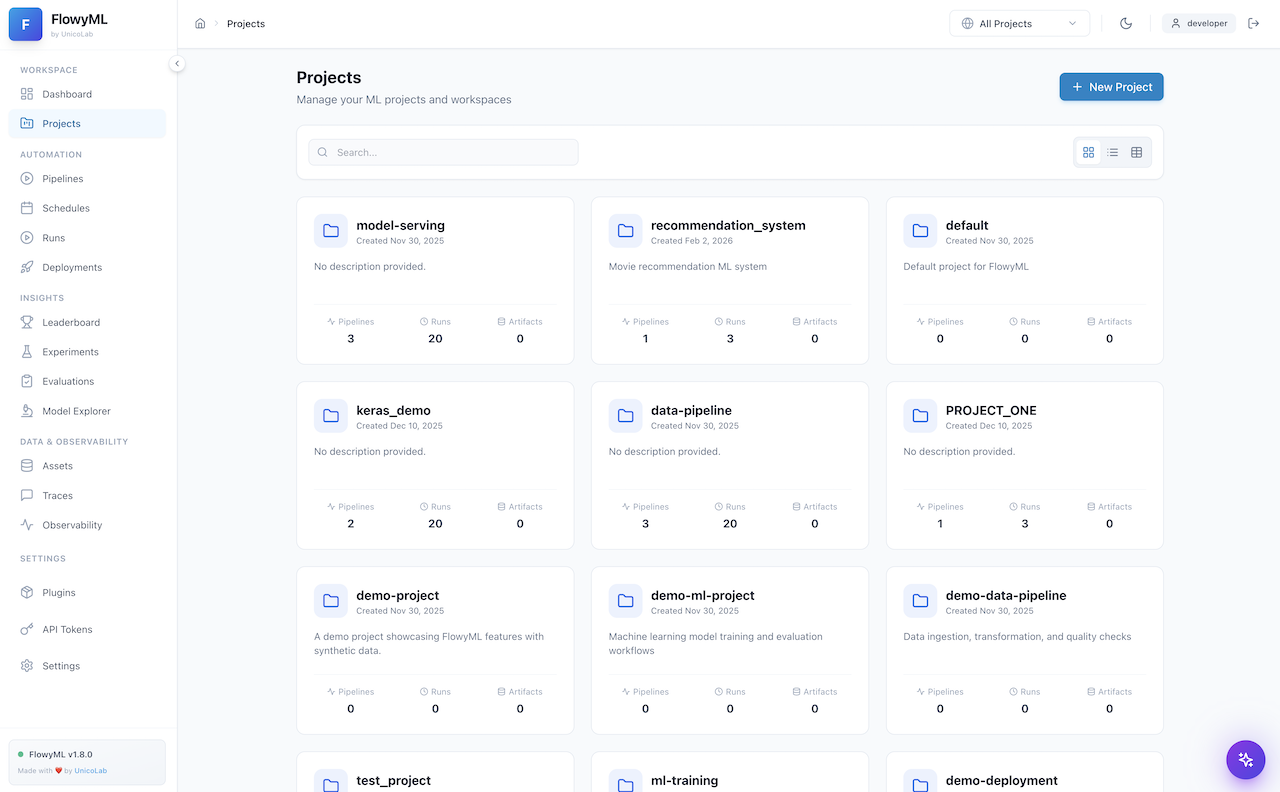
What you can do:
- Create & manage projects — Group related pipelines, runs, and assets under a single project umbrella
- Search & filter — Quickly locate projects by name or tags
- View project details — See associated pipelines, run counts, and last activity timestamps
- Assign runs — Tag any pipeline run to a specific project for organized tracking
Best Practice
Use projects to separate different ML initiatives (e.g., fraud-detection, recommendation-engine). This keeps your workspace clean and makes team collaboration easier.
Pipeline Runs — Monitor & Inspect
The Pipeline Runs page is the operational hub for monitoring all pipeline executions. It features a dual-pane layout with a run explorer on the left and detailed run inspection on the right.
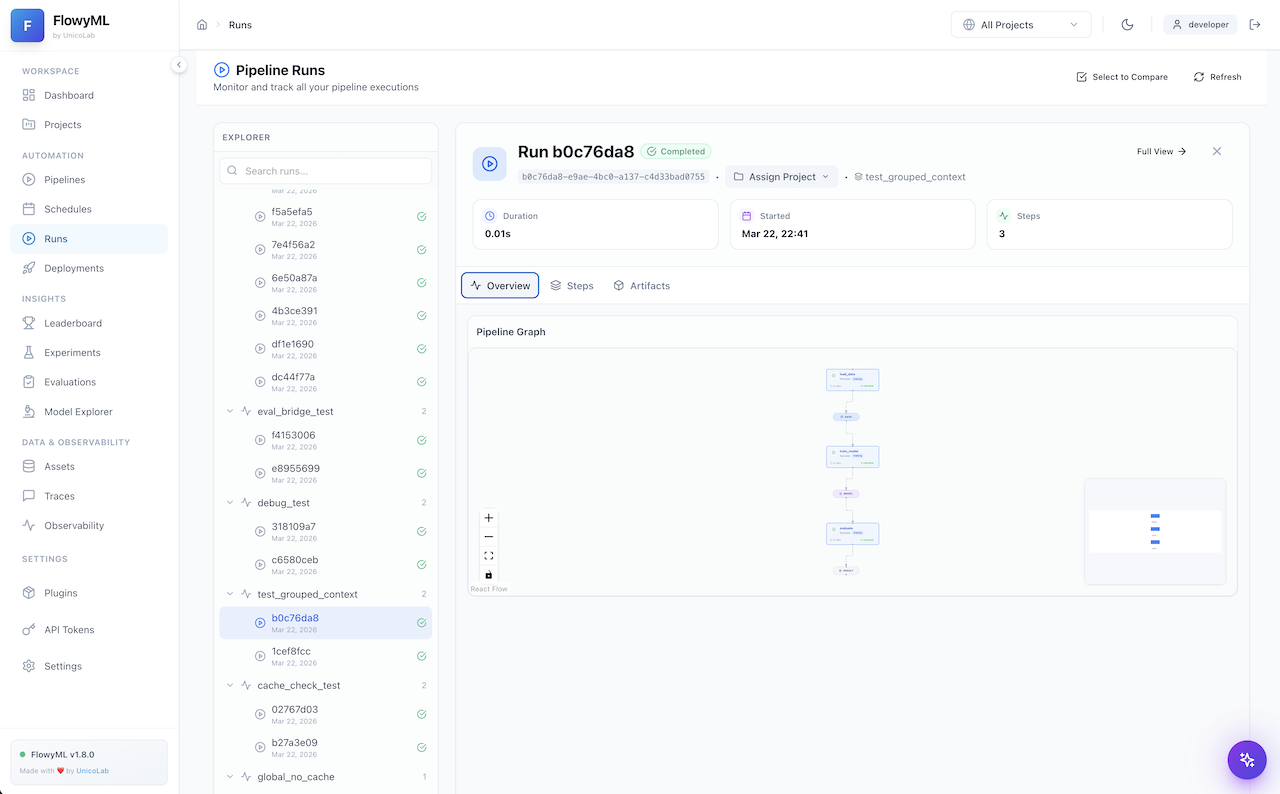
Run Explorer (Left Panel)
- Searchable run list — Filter by run ID, pipeline name, or status
- Grouped by pipeline — Runs are organized under their parent pipeline with expandable sections
- Status indicators — Green checkmarks (✅) for completed, red (❌) for failed, spinner for in-progress
- Timestamp tracking — See exactly when each run was executed
Run Detail (Right Panel)
- Run Header — Shows run ID, completion status, project assignment, and pipeline context
- KPI Cards — Duration, start time, and step count at a glance
- Tabbed Views:
- Overview — Pipeline graph visualization (interactive React Flow DAG)
- Steps — Detailed per-step execution breakdown with inputs/outputs
- Artifacts — All artifacts produced by the run, downloadable
Pipeline Graph
The interactive DAG visualization lets you zoom, pan, and click on individual steps to inspect their execution details. Use the controls (➕, ➖, 🔍, 🔒) in the bottom-left corner.
Run Detail — Deep Dive
Clicking on any specific run opens the full Run Detail view with comprehensive execution information.
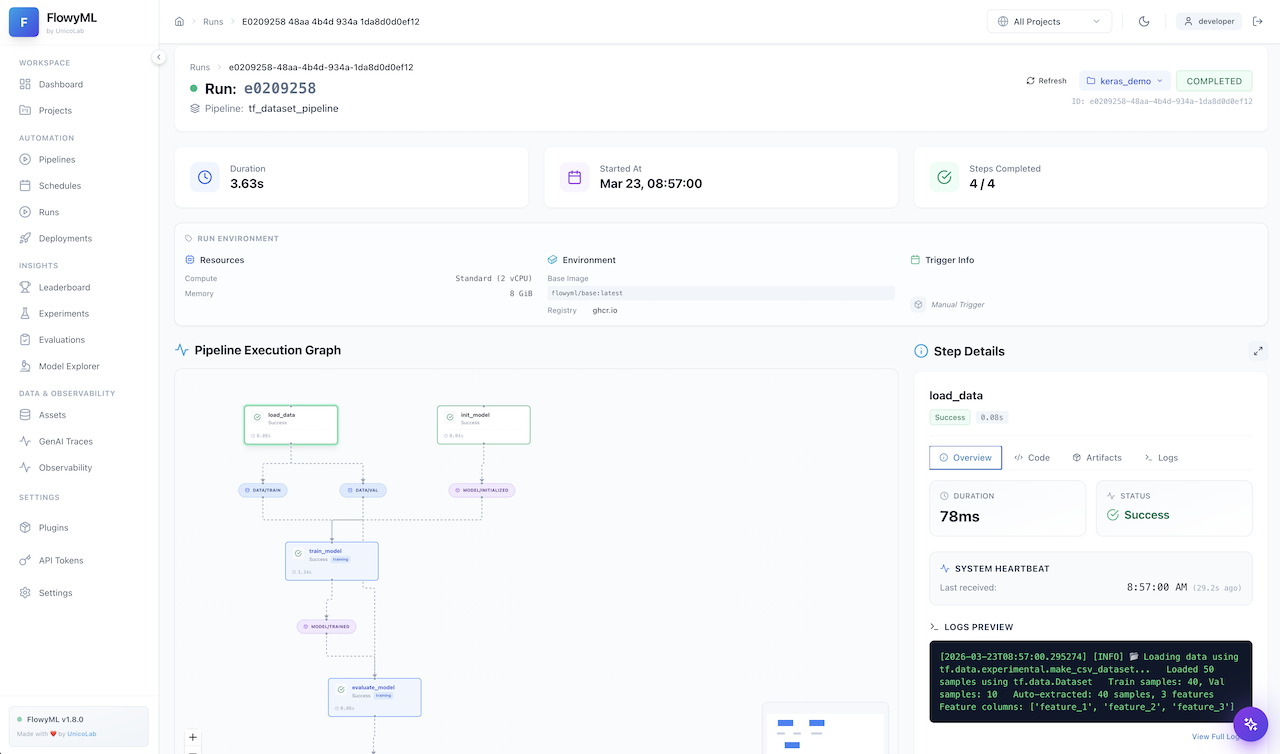
Features available:
- Full pipeline graph — Interactive DAG showing step dependencies and execution flow
- Step-by-step inspection — Click any step node for its inputs, outputs, duration, and logs
- Artifact browser — Browse, preview, and download all artifacts from the run
- Execution metadata — Complete context including timestamps, orchestrator info, and stack configuration
- Run comparison — Use the "Select to Compare" button to diff two runs side-by-side
Assets — Artifact Inspector
The Assets page provides a centralized view of all artifacts produced across your pipeline runs, organized by type.
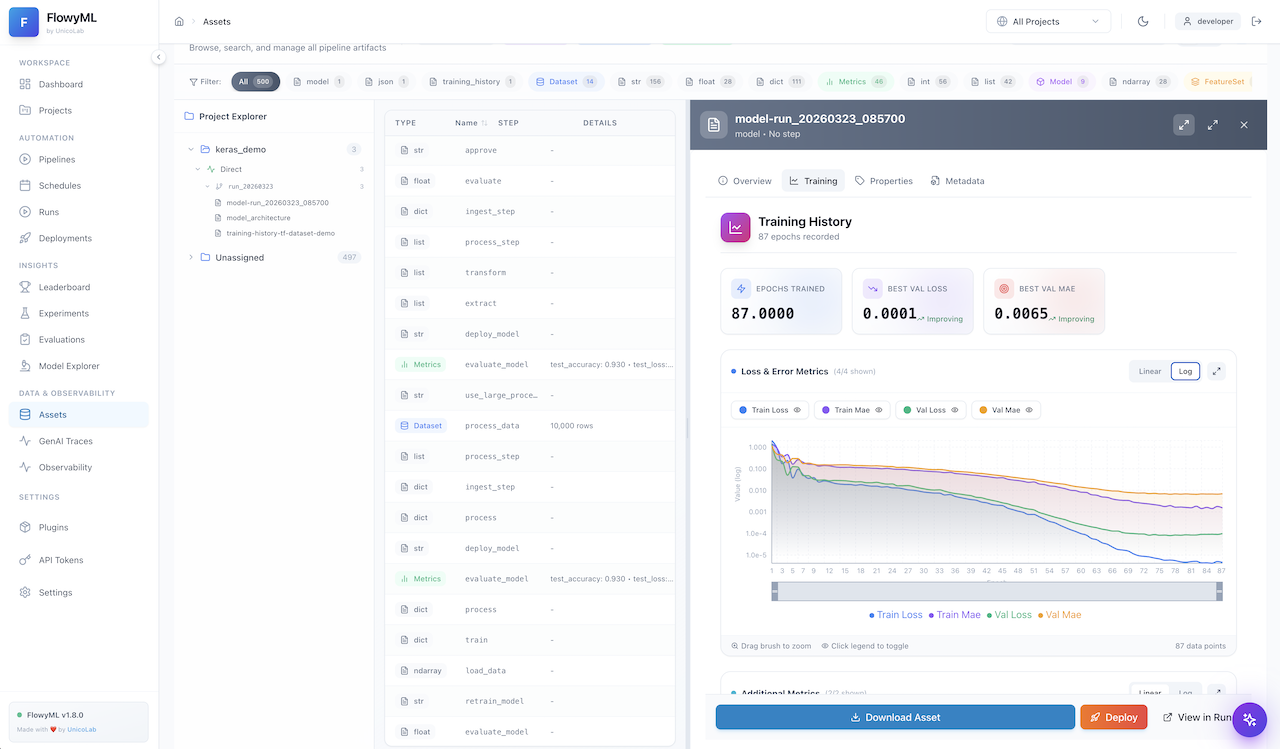
Asset types include:
| Type | Description |
|---|---|
| Models 🤖 | Trained ML models with framework metadata (Keras, PyTorch, Scikit-learn, etc.) |
| Metrics 📊 | Evaluation metrics (MAE, MSE, R², MAPE) with trend indicators |
| DataFrames 📋 | Tabular data artifacts with column previews and row counts |
| Visualizations 📈 | Charts, plots, and training curves generated during runs |
| Custom 🗂️ | Any user-defined artifact type via materializers |
Actions per asset:
- Preview — Quick inline preview of metrics, data, or model metadata
- Download — Export any artifact to your local filesystem
- Properties — View up to 18+ properties including framework, layers, parameters, and epochs
- Metadata — Full provenance info: which step produced it, when, and in which run
Data Details — Rich Previews
Clicking on a data artifact opens a rich detail panel with multi-tab inspection.
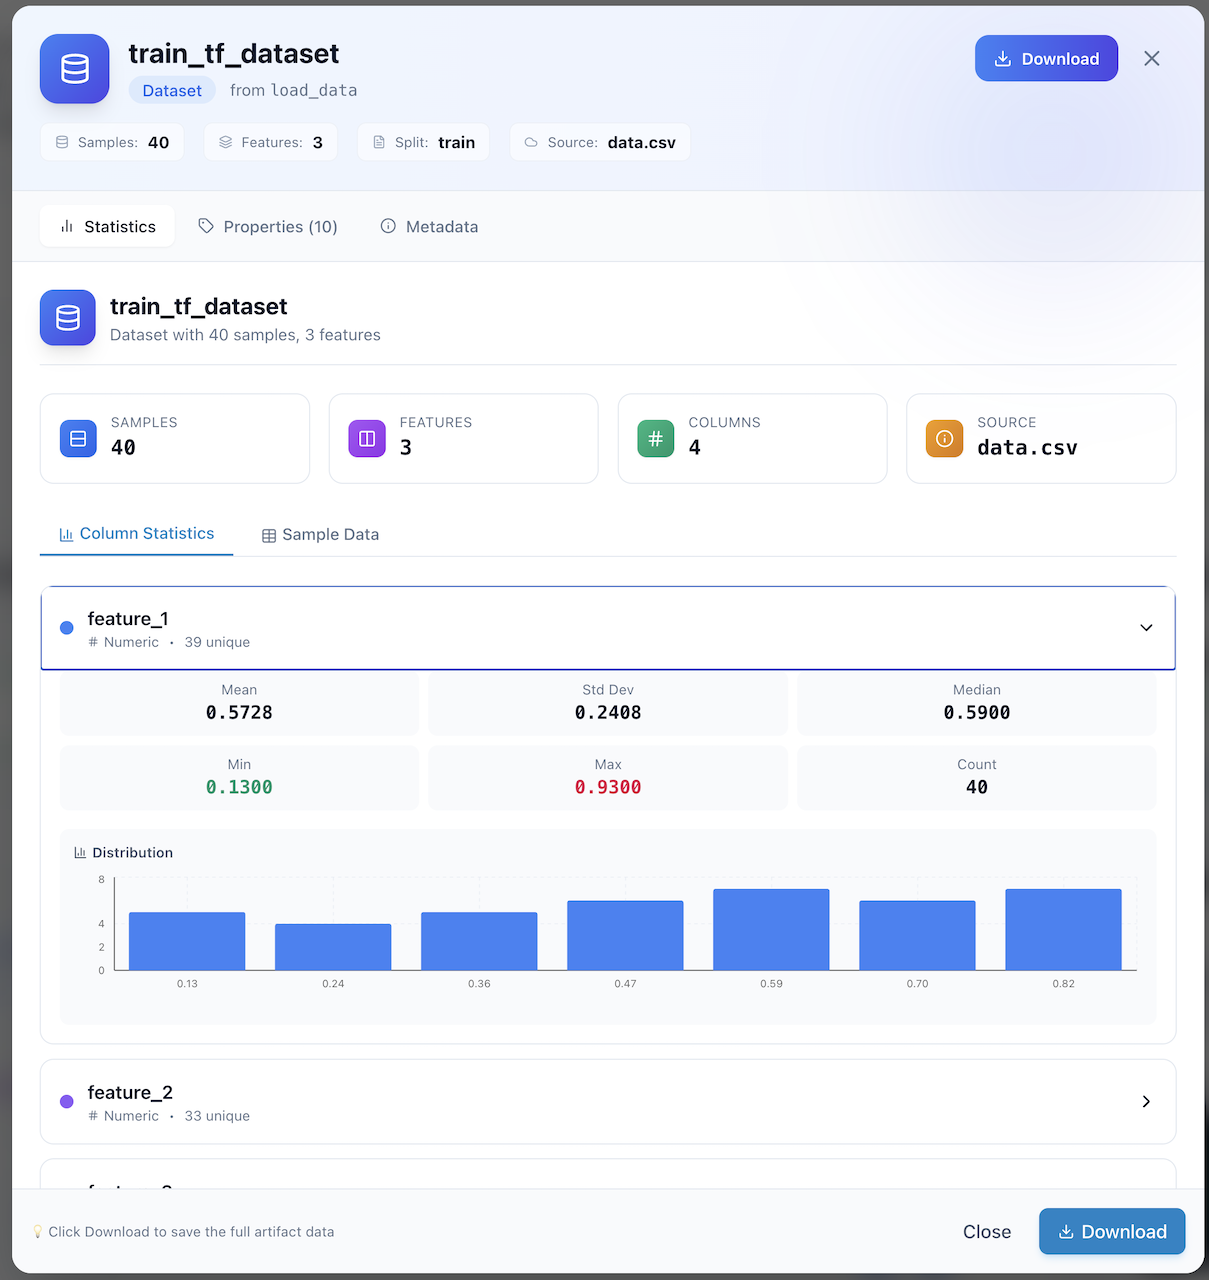
Tabs available:
- Data Preview — Rendered table view of DataFrame contents with column types
- Properties — Schema information, row/column counts, and custom tags
- Metadata — Full lineage: producing step, pipeline, run ID, and timestamps
Large DataFrames
For large datasets, the preview shows the first N rows with a download link for the complete data. This keeps the UI responsive even with millions of rows.
Evaluation Metrics — Model Performance
The Evaluation Details panel provides a focused view of model performance metrics produced by evaluation steps.
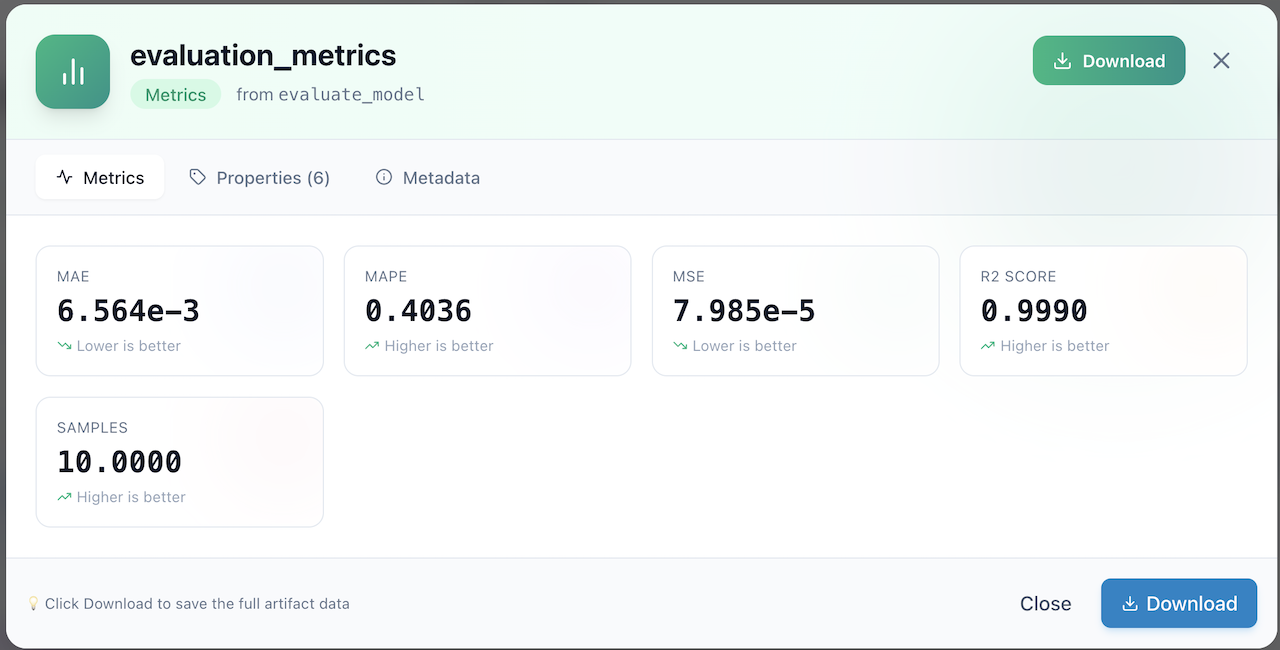
Highlights:
- Metric Cards — Large, scannable KPI cards for each metric (MAE, MAPE, MSE, R²)
- Trend Indicators — Each metric shows whether lower is better (↘) or higher is better (↗)
- Sample Count — Shows the number of samples used in the evaluation
- Multi-tab View — Switch between Metrics, Properties (6+), and Metadata tabs
- Download — Export the full evaluation data for offline analysis
R² Score
The screenshot shows an R² score of 0.9990, indicating near-perfect model fit. FlowyML automatically surfaces these key metrics so you can validate model quality at a glance.
Model Training Curves — Visualization
The Model Visualization panel provides deep insight into your trained models, including interactive training history charts.
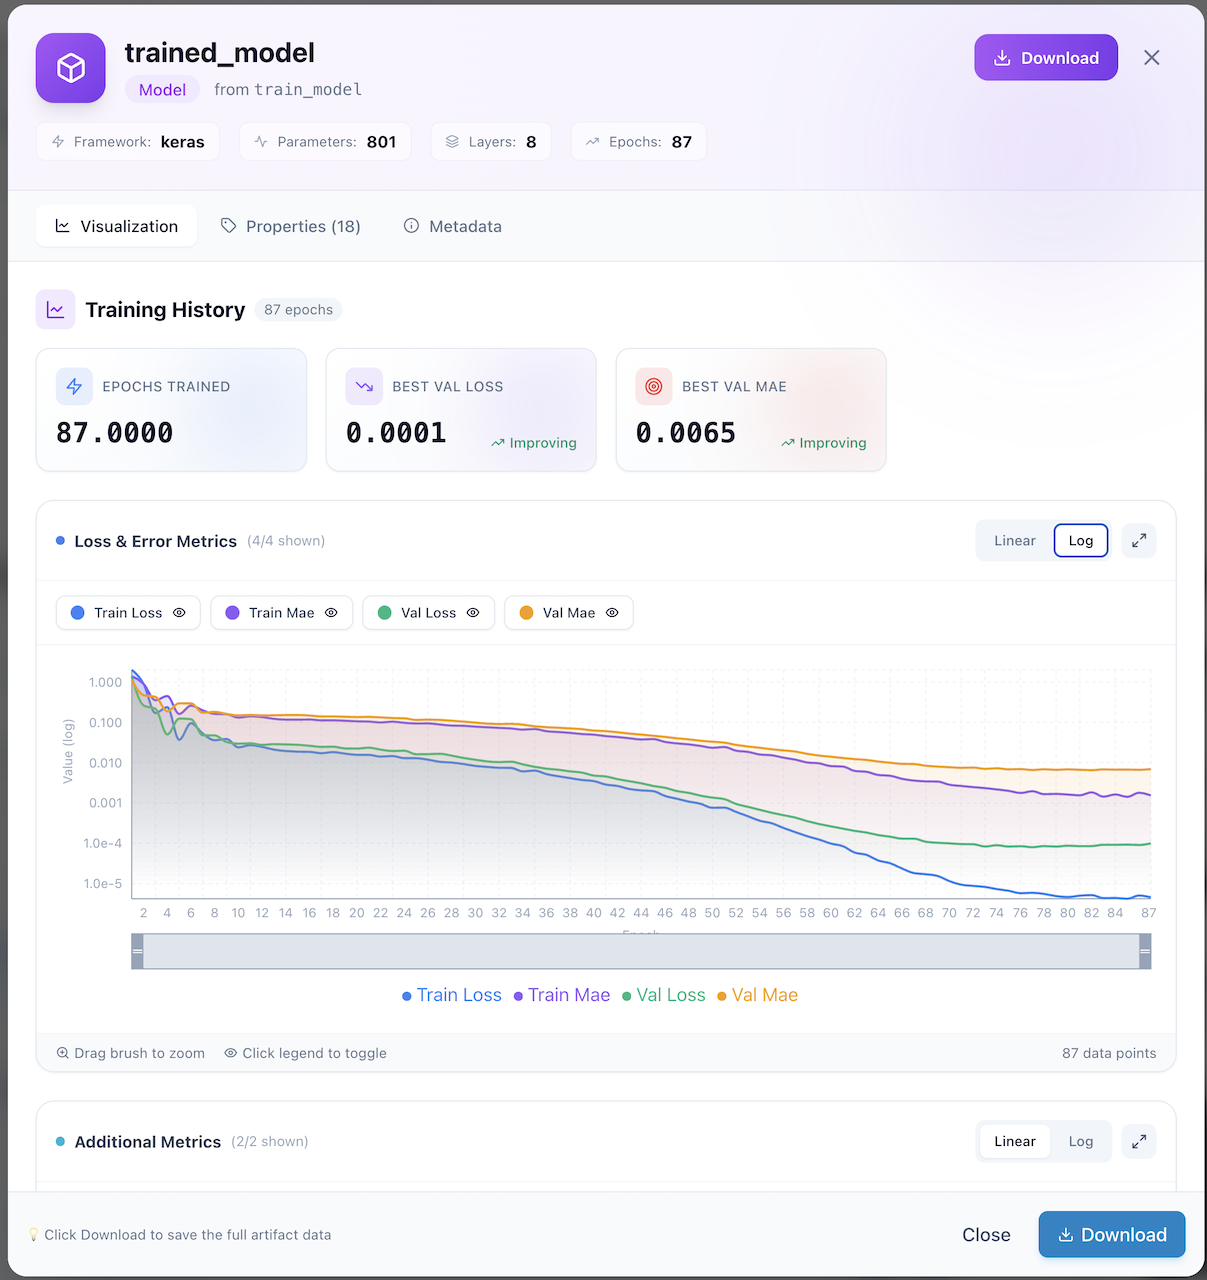
What you get:
- Model Header — Framework (Keras), parameter count (801), layer count (8), epochs (87)
- Training Summary Cards — Epochs trained, best validation loss, best validation MAE with improvement indicators
- Interactive Charts:
- Loss & Error Metrics — Train Loss, Train MAE, Val Loss, Val MAE plotted over epochs
- Log/Linear toggle — Switch between logarithmic and linear scale
- Brush-to-zoom — Drag to select a region for detailed inspection
- Legend toggle — Click legend items to show/hide individual series
- Additional Metrics — Supplementary metrics below the main chart
Zoom & Explore
Use the brush tool at the bottom of the chart to zoom into specific epoch ranges. Click the expand icon (↗️) for a full-screen chart view.
GenAI Traces — LLM Observability
The Traces page provides enterprise-grade observability for all GenAI and LLM operations in your pipelines.
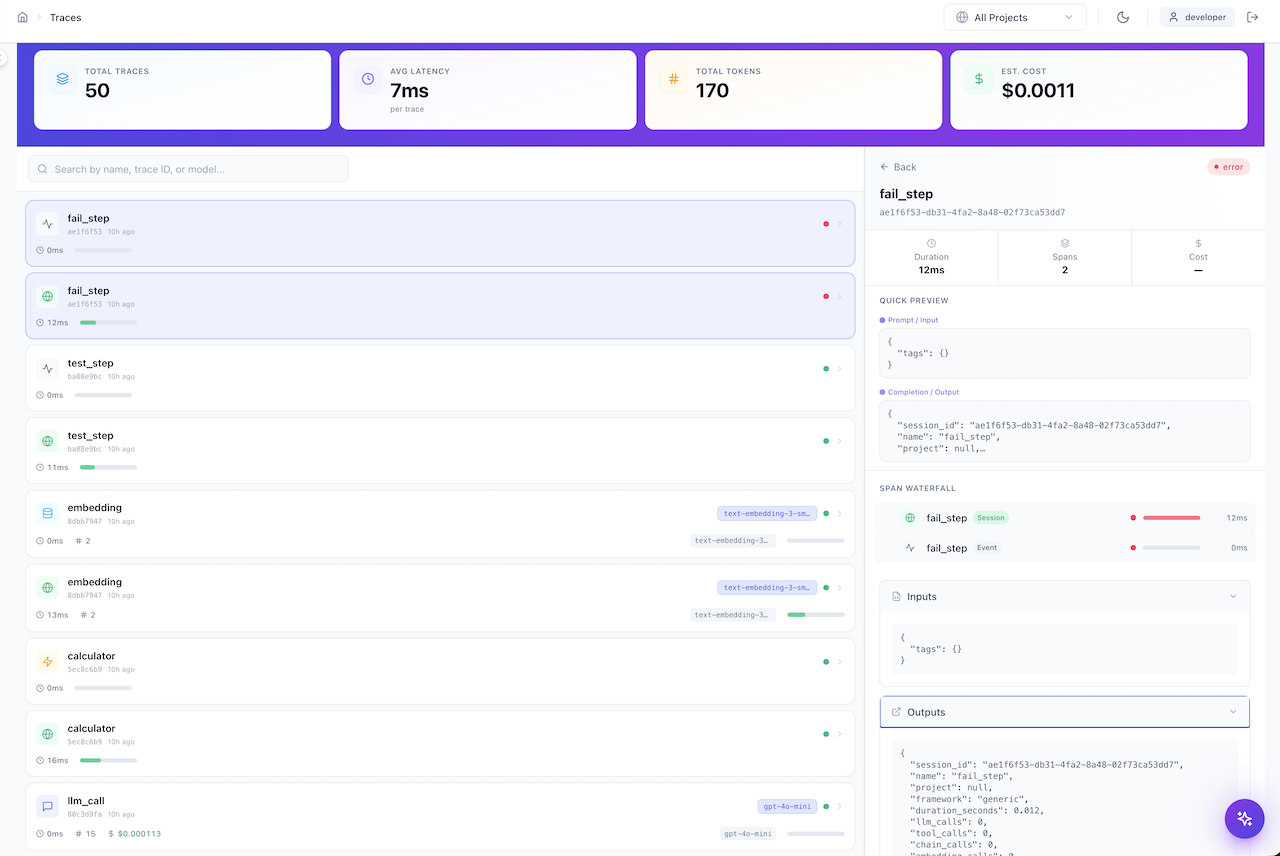
Summary Bar (Top)
| Metric | Description |
|---|---|
| Total Traces | Count of all traced GenAI operations |
| Avg Latency | Mean response time per trace |
| Total Tokens | Cumulative token usage across all LLM calls |
| Est. Cost | Estimated cost based on token usage and model pricing |
Trace List (Left Panel)
- Filterable — Search by name, trace ID, or model name
- Color-coded status — Green dots for successful traces, red for errors
- Model badges — Shows the LLM model used (e.g.,
text-embedding-3-sm...,gpt-4o-mini) - Duration bars — Visual progress bars showing relative execution time
- Token counts — Number of tokens used per trace
Trace Detail (Right Panel)
- Span Waterfall — Hierarchical breakdown of trace spans (Session → Event)
- Quick Preview — Prompt/Input and Completion/Output at a glance
- Duration & Cost — Per-trace timing, span count, and cost
- Inputs/Outputs — Full JSON view of inputs and outputs for each span
Cost Tracking
GenAI cost tracking requires model pricing configuration. See the GenAI Observability guide for setup instructions.
Plugins & Integrations — Extend FlowyML
The Plugins page is your marketplace for extending FlowyML with cloud providers, orchestrators, and third-party ML platforms.
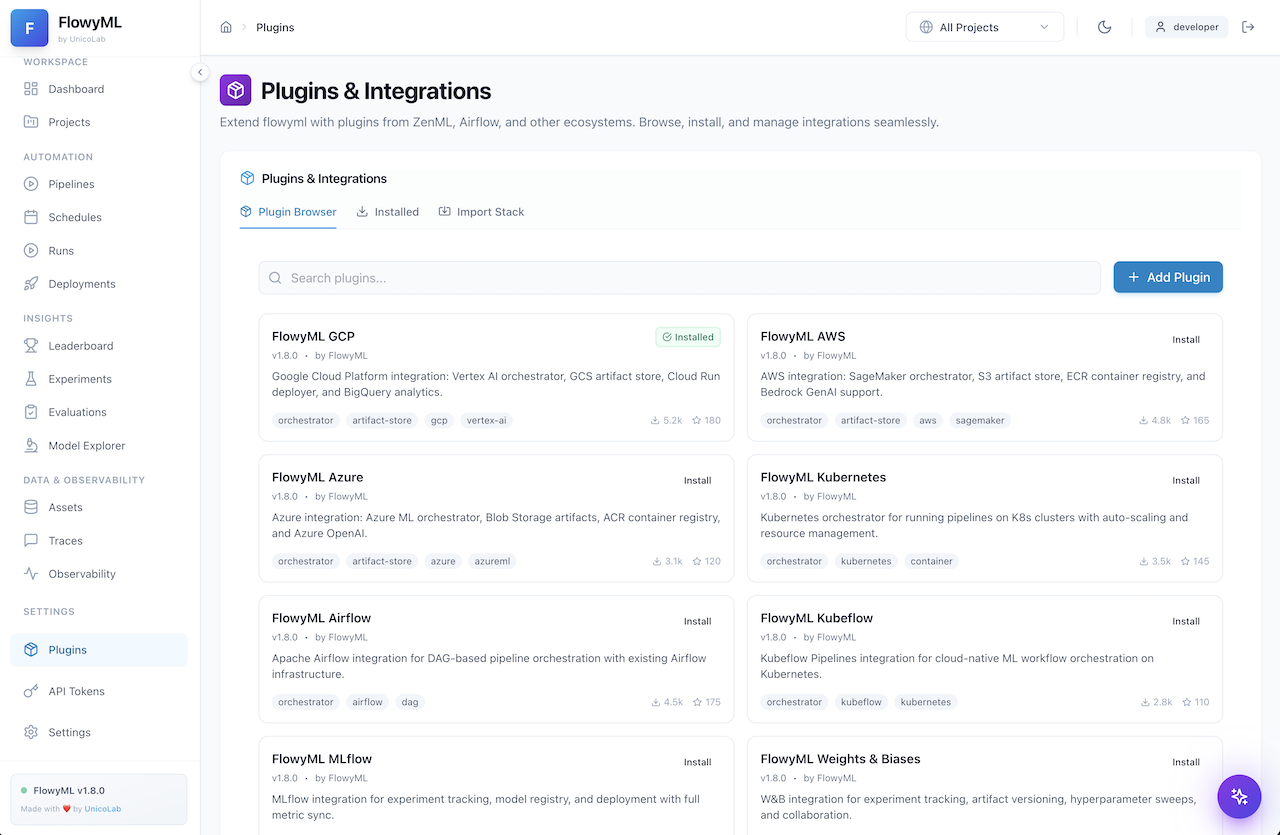
Plugin Browser
Browse the available plugins organized in a card-grid layout:
| Plugin | Description |
|---|---|
| FlowyML GCP | Vertex AI orchestrator, GCS artifact store, Cloud Run deployer, BigQuery analytics |
| FlowyML AWS | SageMaker orchestrator, S3 artifact store, ECR container registry, Bedrock GenAI |
| FlowyML Azure | Azure ML orchestrator, Blob Storage artifacts, ACR registry, Azure OpenAI |
| FlowyML Kubernetes | K8s orchestrator with auto-scaling and resource management |
| FlowyML Airflow | DAG-based pipeline orchestration with Airflow infrastructure |
| FlowyML Kubeflow | Cloud-native ML workflow orchestration on Kubernetes |
| FlowyML MLflow | Experiment tracking, model registry, and full metric sync |
| FlowyML W&B | Weights & Biases integration for experiment tracking and hyperparameter sweeps |
Features:
- One-click install — Install plugins directly from the UI
- Search & filter — Find plugins by name, tag, or category
- Tag system — Each plugin shows capability tags (orchestrator, artifact-store, etc.)
- Download stats — See community adoption with download counts and star ratings
- Import Stack — Import a complete stack configuration from a file
Stack Import
Use the "Import Stack" tab to load a pre-configured stack YAML file that bundles multiple plugins together for a specific deployment target.
Deployment Lab — Ship Models to Production
The Deployment Lab lets you deploy trained models as API endpoints with a few clicks.
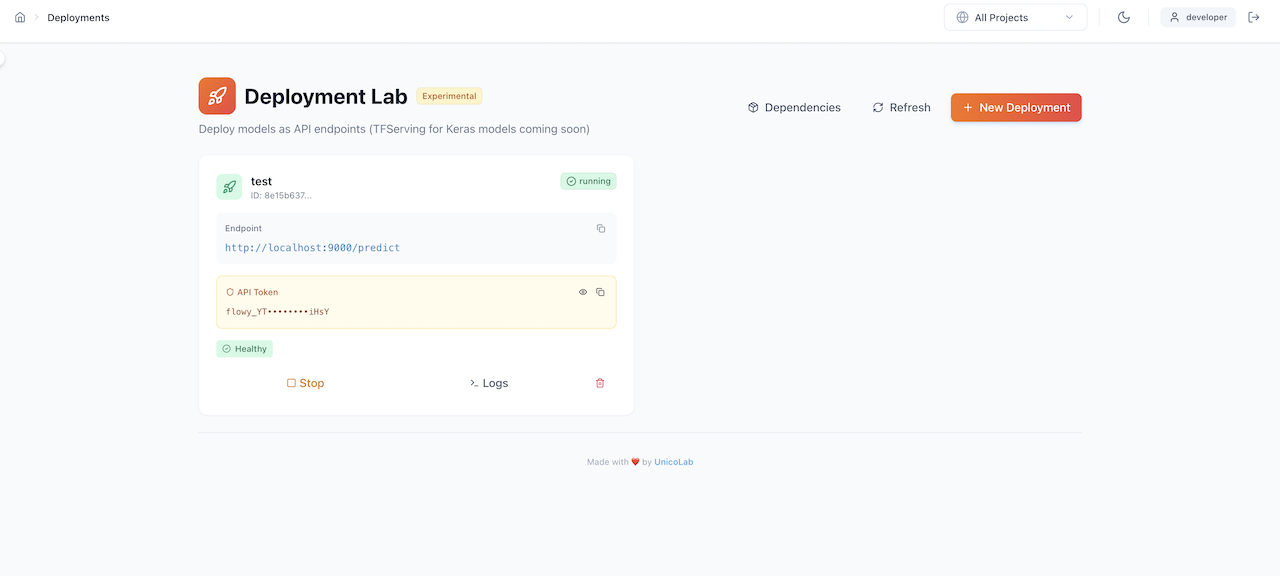
Deployment features:
- Endpoint management — View active deployments with their URLs and status
- API Token — Secure your endpoints with auto-generated API tokens (shown masked, reveal on click)
- Health monitoring — Real-time health status indicators (✅ Healthy)
- Lifecycle controls:
- Stop — Gracefully stop a running deployment
- Logs — View real-time deployment logs
- Delete — Remove a deployment and its resources
- Dependencies — View model dependencies required by the endpoint
- New Deployment — One-click wizard to deploy a new model
Experimental
The Deployment Lab is currently marked as Experimental. TFServing for Keras models is coming soon.
Scheduler — Automate Pipeline Execution
The Scheduler dialog allows you to set up automated, recurring pipeline executions.
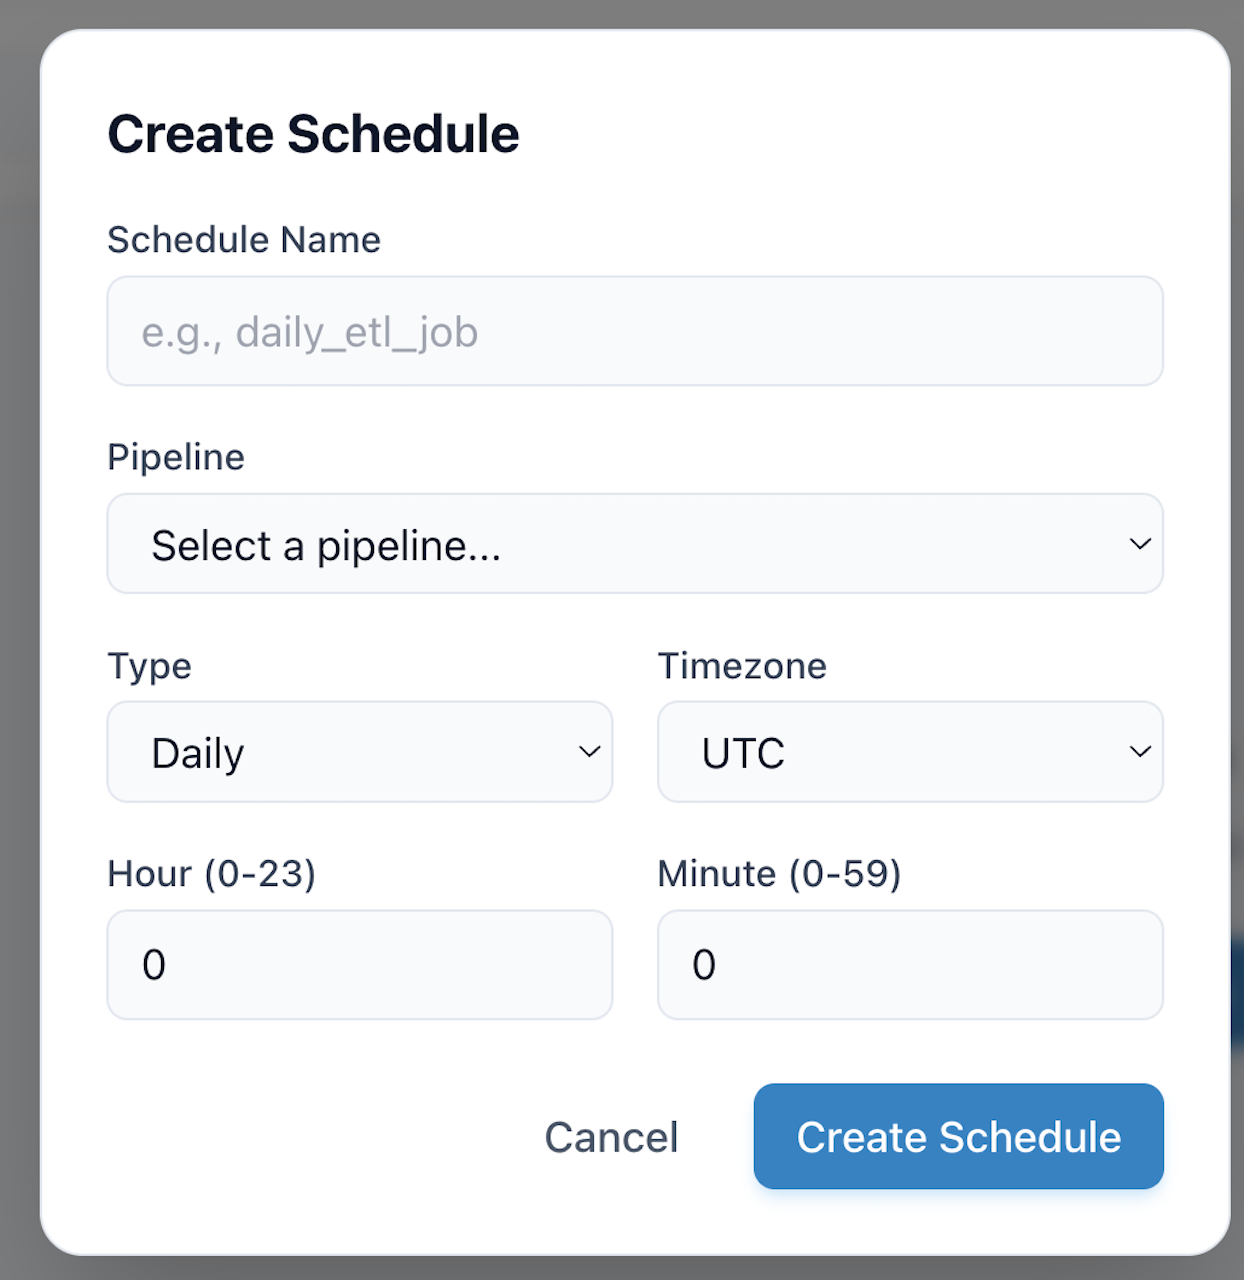
Configuration options:
| Field | Description |
|---|---|
| Schedule Name | A human-readable name (e.g., daily_etl_job) |
| Pipeline | Select which pipeline to schedule from the dropdown |
| Type | Schedule frequency: Daily, Hourly, Weekly, Monthly, or Cron |
| Timezone | Timezone for schedule execution (UTC, US/Eastern, Europe/London, etc.) |
| Hour / Minute | Specific time for daily/weekly/monthly schedules |
Cron Expressions
For advanced scheduling, select "Cron" type and provide a standard cron expression (e.g., 0 */6 * * * for every 6 hours).
Navigation Reference
The sidebar provides organized access to every feature:
WORKSPACE
  ├── Dashboard          → Command center overview
  └── Projects           → Project management

AUTOMATION
  ├── Pipelines          → Pipeline definitions
  ├── Schedules          → Automated scheduling
  ├── Runs               → Execution history & monitoring
  └── Deployments        → Model serving endpoints

INSIGHTS
  ├── Leaderboard        → Model comparison rankings
  ├── Experiments        → Experiment tracking
  ├── Evaluations        → Evaluation management
  └── Model Explorer     → Trained model browser

DATA & OBSERVABILITY
  ├── Assets             → Artifact catalog
  ├── Traces             → GenAI/LLM observability
  └── Observability      → System-wide dashboards

SETTINGS
  ├── Plugins            → Plugin marketplace
  ├── API Tokens         → Token management
  └── Settings           → System configuration
Tips & Keyboard Shortcuts
Power User Tips
- Project Filtering — Use the top-right "All Projects" dropdown to scope every page to a specific project
- Dark Mode — Toggle with the 🌙 icon for a reduced-glare experience
- Full View — Click "Full View →" on any run or artifact detail for an expanded, dedicated page
- Compare Runs — Select multiple runs via checkboxes, then click "Select to Compare" for side-by-side diff
- Quick Search — Use the search bars on the Runs, Assets, Traces, and Plugins pages for instant filtering
- Download Artifacts — Every artifact view includes a Download button for offline analysis